FET (FET)

$0.1398  -0.85%  24H

Индекс социальных настроений (SSI)

Рейтинг пульса рынка (MPR)

Посты из X

  • More Crypto Online TA_Analyst Educator C
     52.96K  @Morecryptoonl

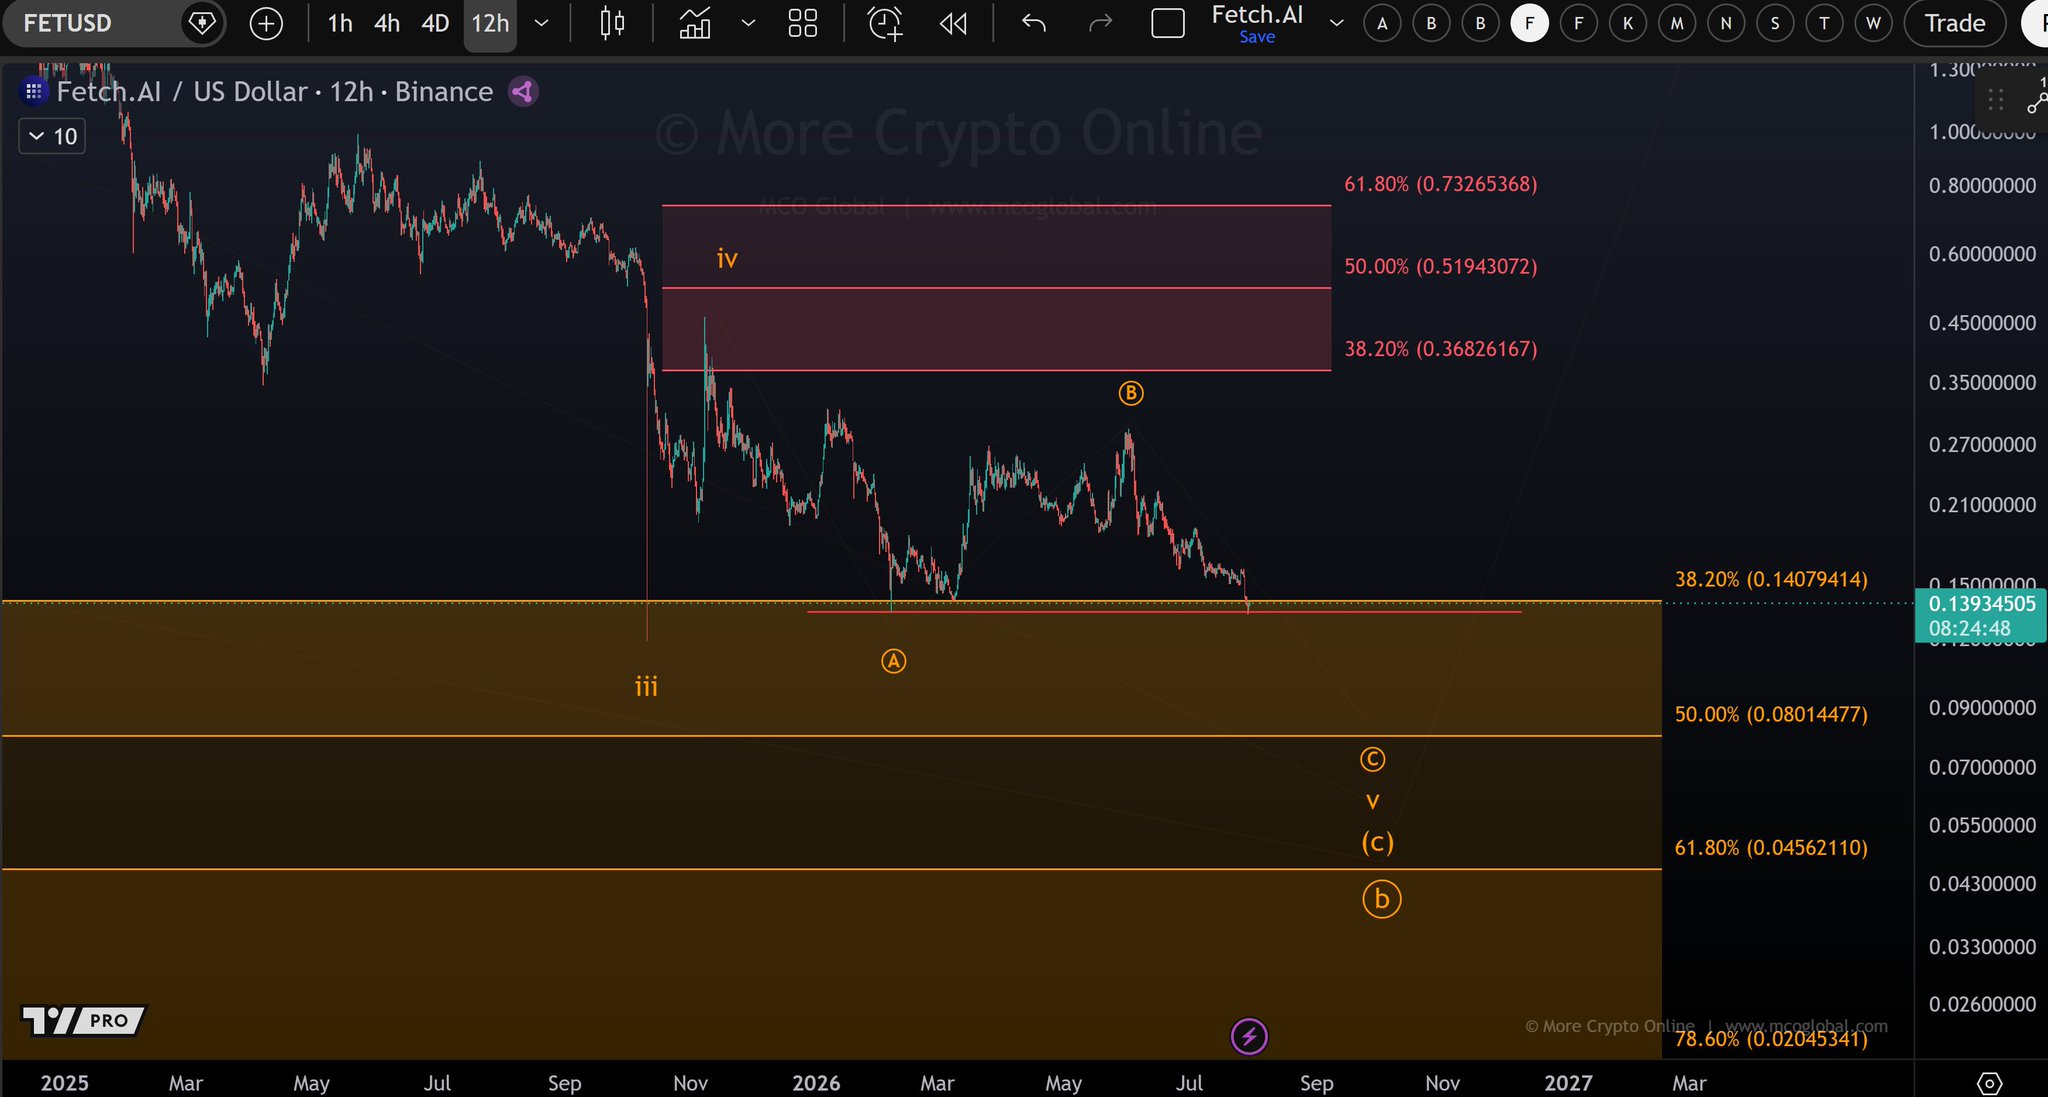
    $FET The price is now testing the February low. It is becoming more and more probable that wave iv has topped already and that wave C of v is already unfolding. https://t.co/2ZHJJXhzUI

    More Crypto Online TA_Analyst Educator C
     52.96K  @Morecryptoonl

    Next chart to analyse? 📈📉

     18  6  4.76K
    Оригинал >
    Тренд FET после выпуска
     Чрезвычайно медвежий
    FET price testing February low, Elliott Wave suggests further decline.
  • Nebraskangooner TA_Analyst Trader C
     407.49K  @Nebraskangooner

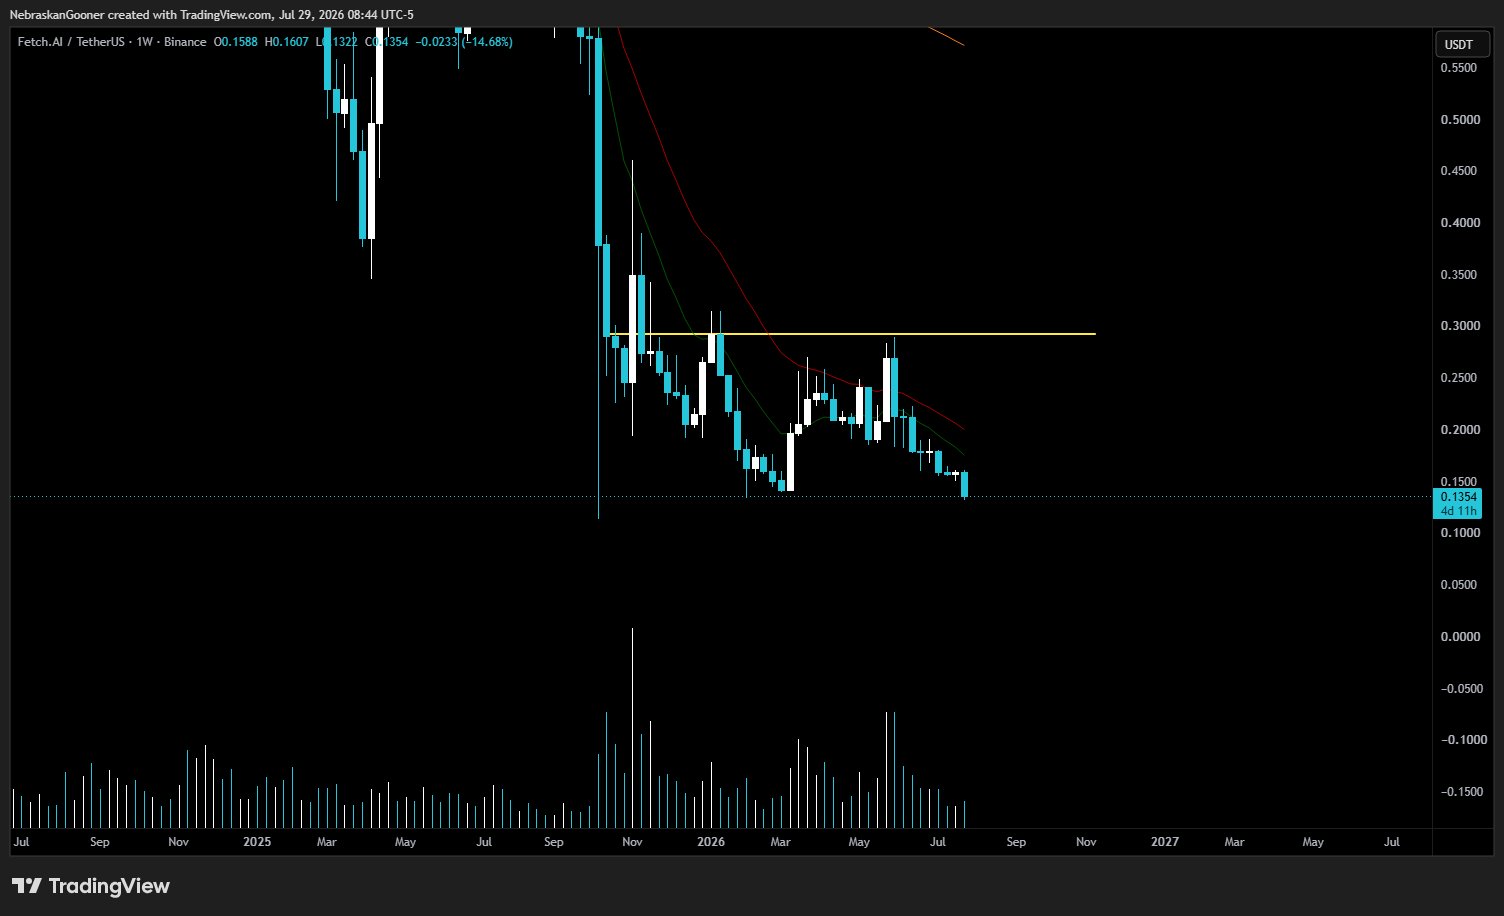
    $FET Down 40% from my last post. Dead altcoin so no sense and trying to knife catch until it proves some sort of trend reversal. https://t.co/WMLPg1xrml

    Nebraskangooner TA_Analyst Trader C
     407.49K  @Nebraskangooner

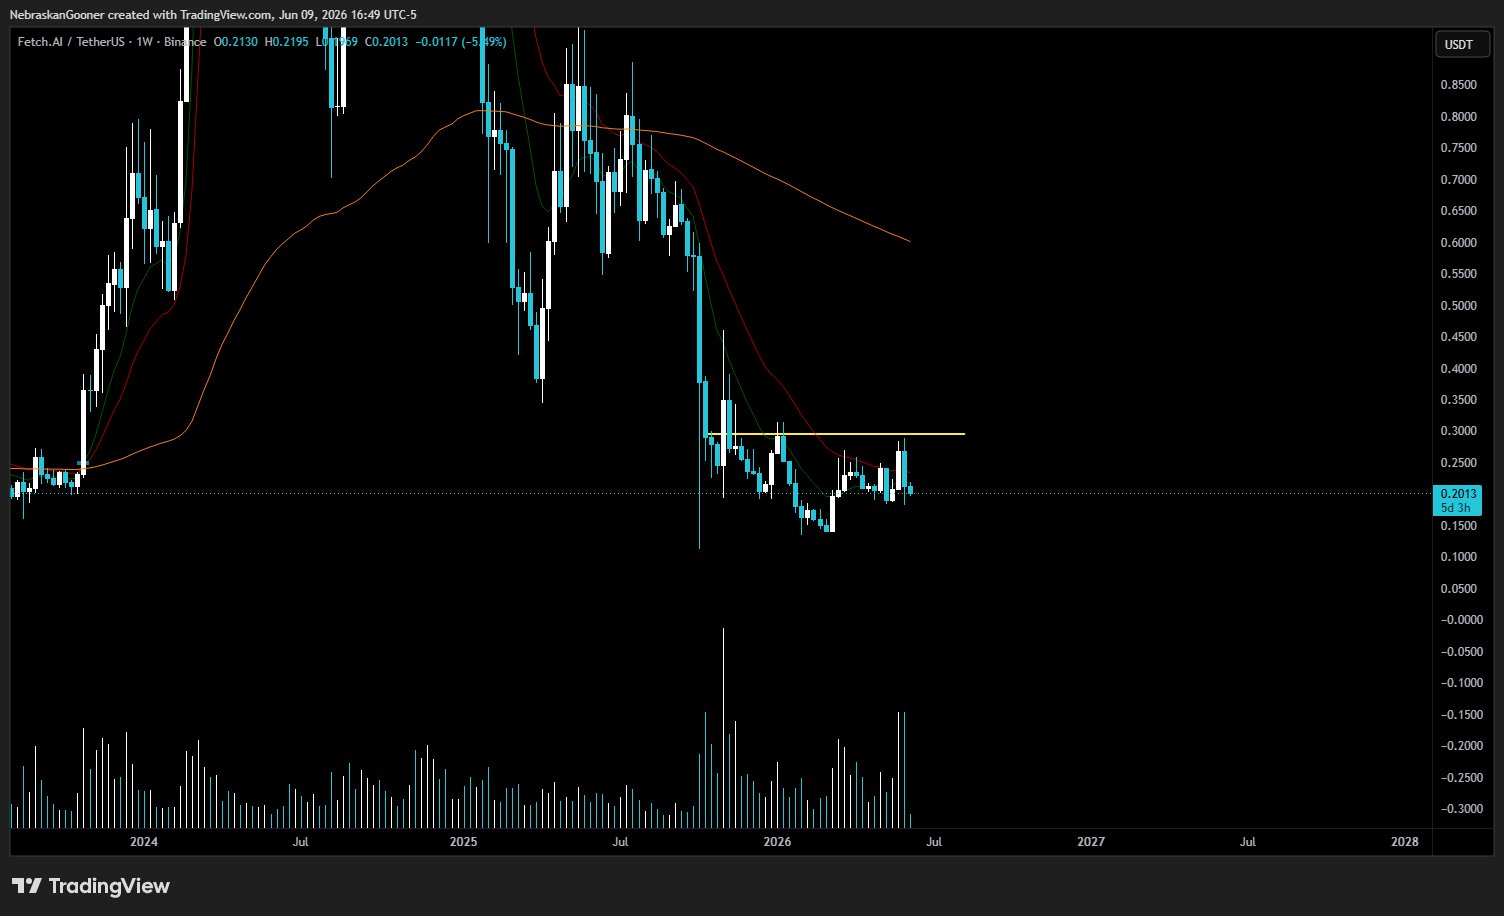
    $FET (per request) Just another dead altcoin chart for now.. if it gets back above 30 cents I may have some interest in it. https://t.co/oqFfOYdmyd

     119  17  26.77K
    Оригинал >
    Тренд FET после выпуска
     Медвежий
    FET down 40% is regarded as a “dead coin”, recommend waiting until it breaks $0.30.
  • CW OnChain_Analyst Trader B
     22.77K  @CW8900

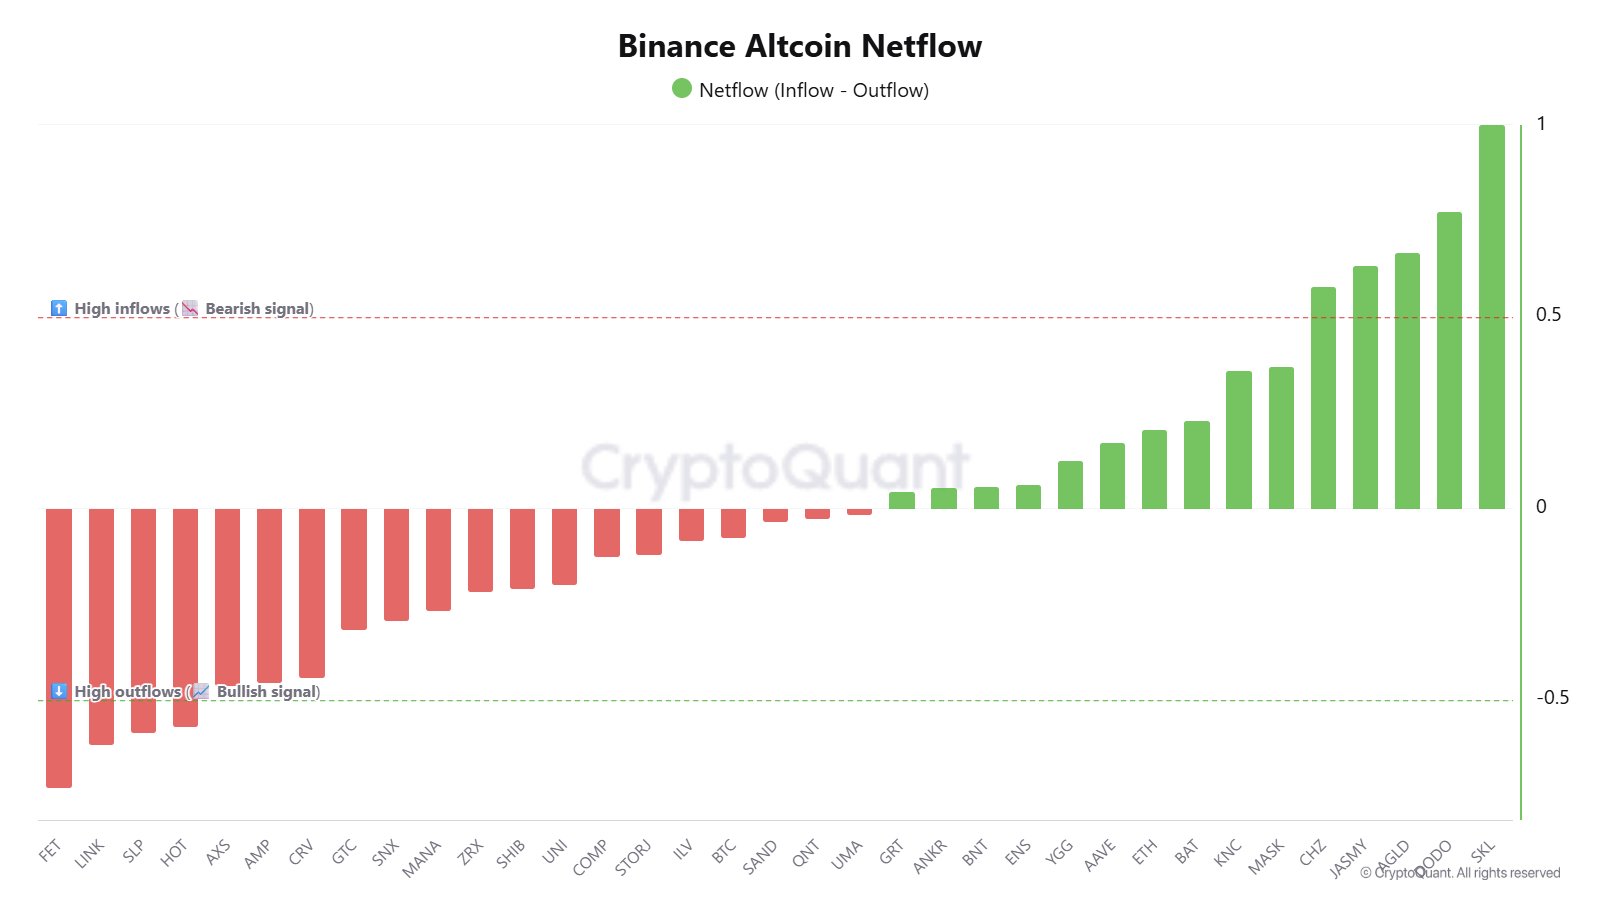
    The coins that saw outflows from Binance are $FET, $LINK, $SLP, and $HOT. Outflows from exchanges are a bullish signal. On the other hand, $SKL, $DODO, $AGLD, $JASMY, and $CHZ saw more inflows. https://t.co/EP5oqIaUP7

     47  2  3.28K
    Оригинал >
    Тренд FET после выпуска
     Нейтрально
    Binance altcoin net flow data shows that outflows of FET, LINK, etc. are bullish, while inflows of SKL, DODO, etc. are bearish.
  • logical TA_Analyst Trader A
     1.38K  @0xLogicalx

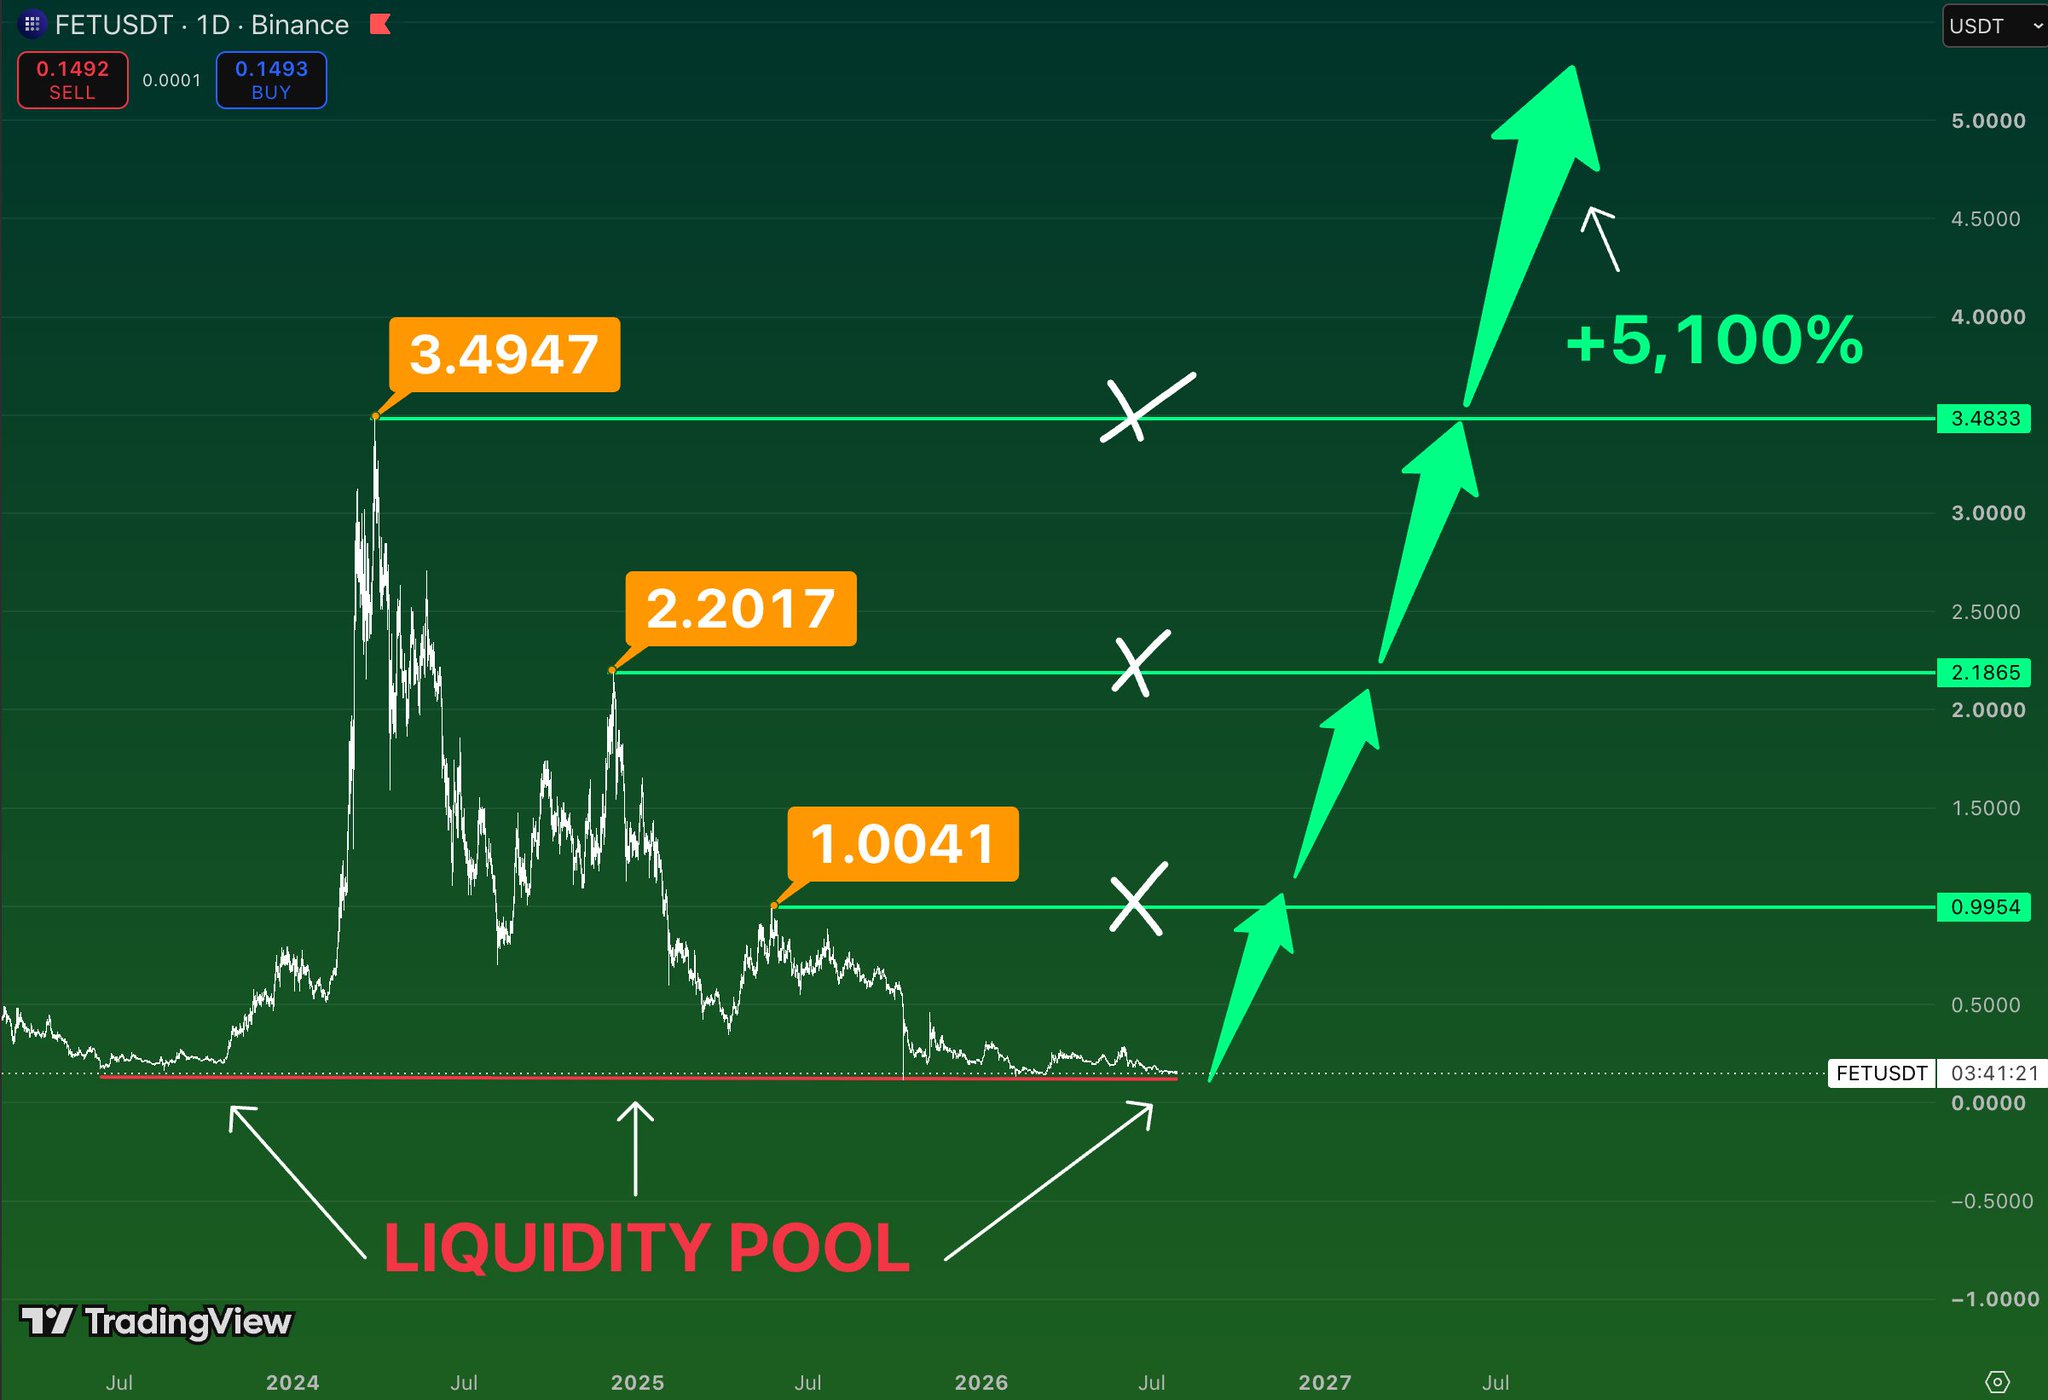
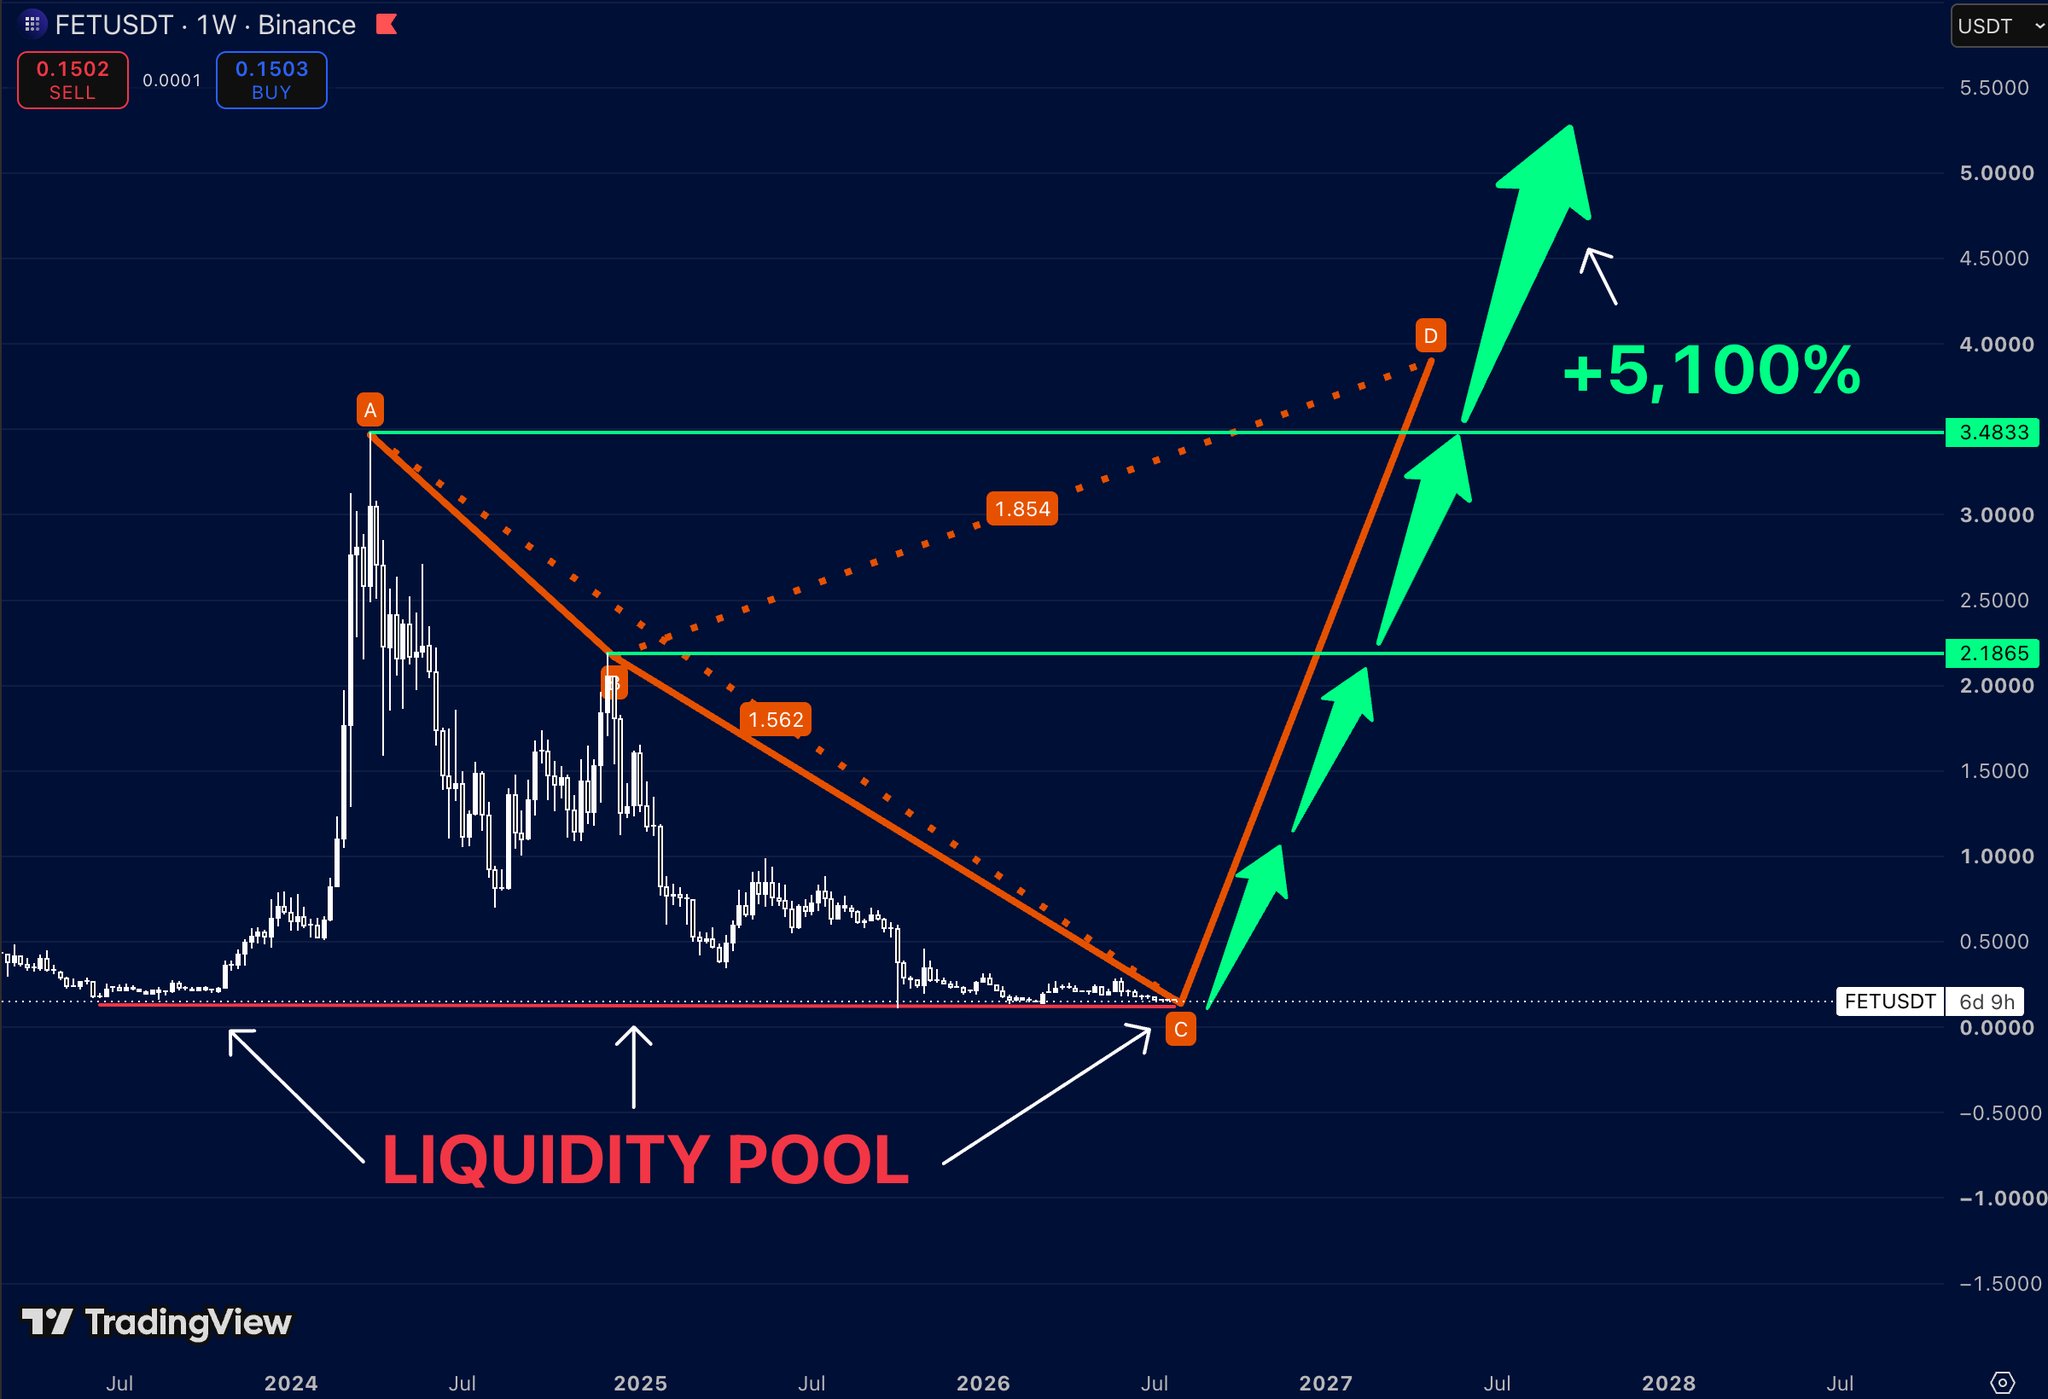
    $FET is holding a major liquidity pool after a prolonged correction. With sellers exhausted and buyers defending long-term support the chart is setting up for a potential multi-stage recovery. The first objective sits near $1.00. Reclaiming that level would be the first signal that long-term momentum is turning back in favor of buyers. Above it, the next major resistance comes in around $2.19. Breaking that zone would confirm a broader trend reversal and open the door for a much stronger expansion. The final macro target stands at $3.48. A move back into that resistance would represent a gain of more than 5,000% from current prices and complete a full recovery toward the previous cycle highs.

     90  9  3.54K
    Оригинал >
    Тренд FET после выпуска
     Чрезвычайно бычий
    FET shows strong recovery potential after a long-term correction, with a target price up to $3.48, representing a gain of over 5,000%.
  • @TakeProfitNow D
     1.15K  @TakePr0fitN0w

    $FET has completed a multi-year correction back into a major liquidity zone. If this base holds, the chart points toward one of the strongest recovery setups among large-cap AI tokens. For nearly three years, sellers controlled every rally. Now price is sitting on the same liquidity area where long-term demand has repeatedly stepped in. The first major objective is $2.19. Reclaiming that level would confirm that the long-term trend has shifted back in favor of buyers. Above it, the next resistance sits around $3.48. Breaking that zone would put the previous cycle highs back within reach and likely attract a fresh wave of momentum. From current levels, the full move projects more than 5,000% upside. If the AI narrative returns in full force, $FET is one of the charts that could surprise the market.

     330  59  14.67K
    Оригинал >
    Тренд FET после выпуска
     Чрезвычайно бычий
    FET has completed a multi-year correction and is in a liquidity zone, with the technical chart showing over 5,000% upside potential.
  • CW OnChain_Analyst Trader B
     22.77K  @CW8900

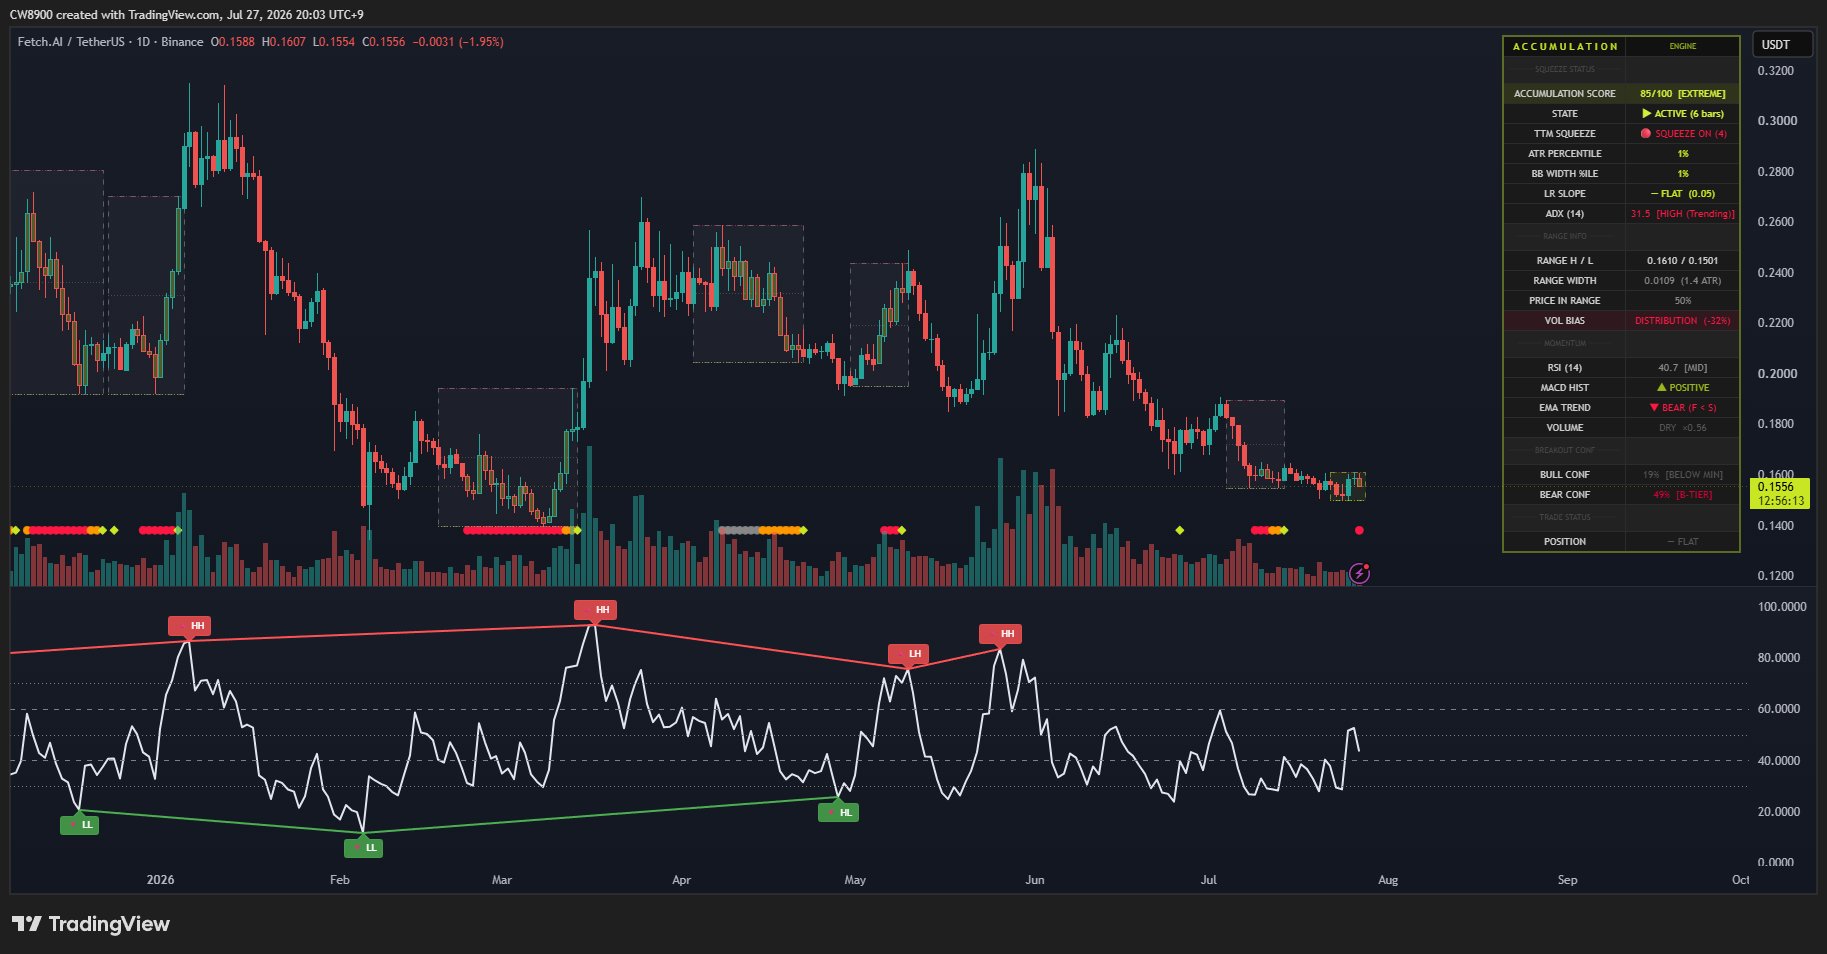
    The accumulation of $FET has continued for 6 days. The accumulation score is 85. The accumulation range is $0.15-$0.161. https://t.co/SHjl04uXCw

     117  10  6.01K
    Оригинал >
    Тренд FET после выпуска
     Чрезвычайно бычий
    FET has been in an extreme accumulation state for 6 consecutive days, with an accumulation score of 85 and an accumulation range of $0.15-$0.161.
  • AYMAN TA_Analyst Trader S
     3.75K  @Crypto_Ayman

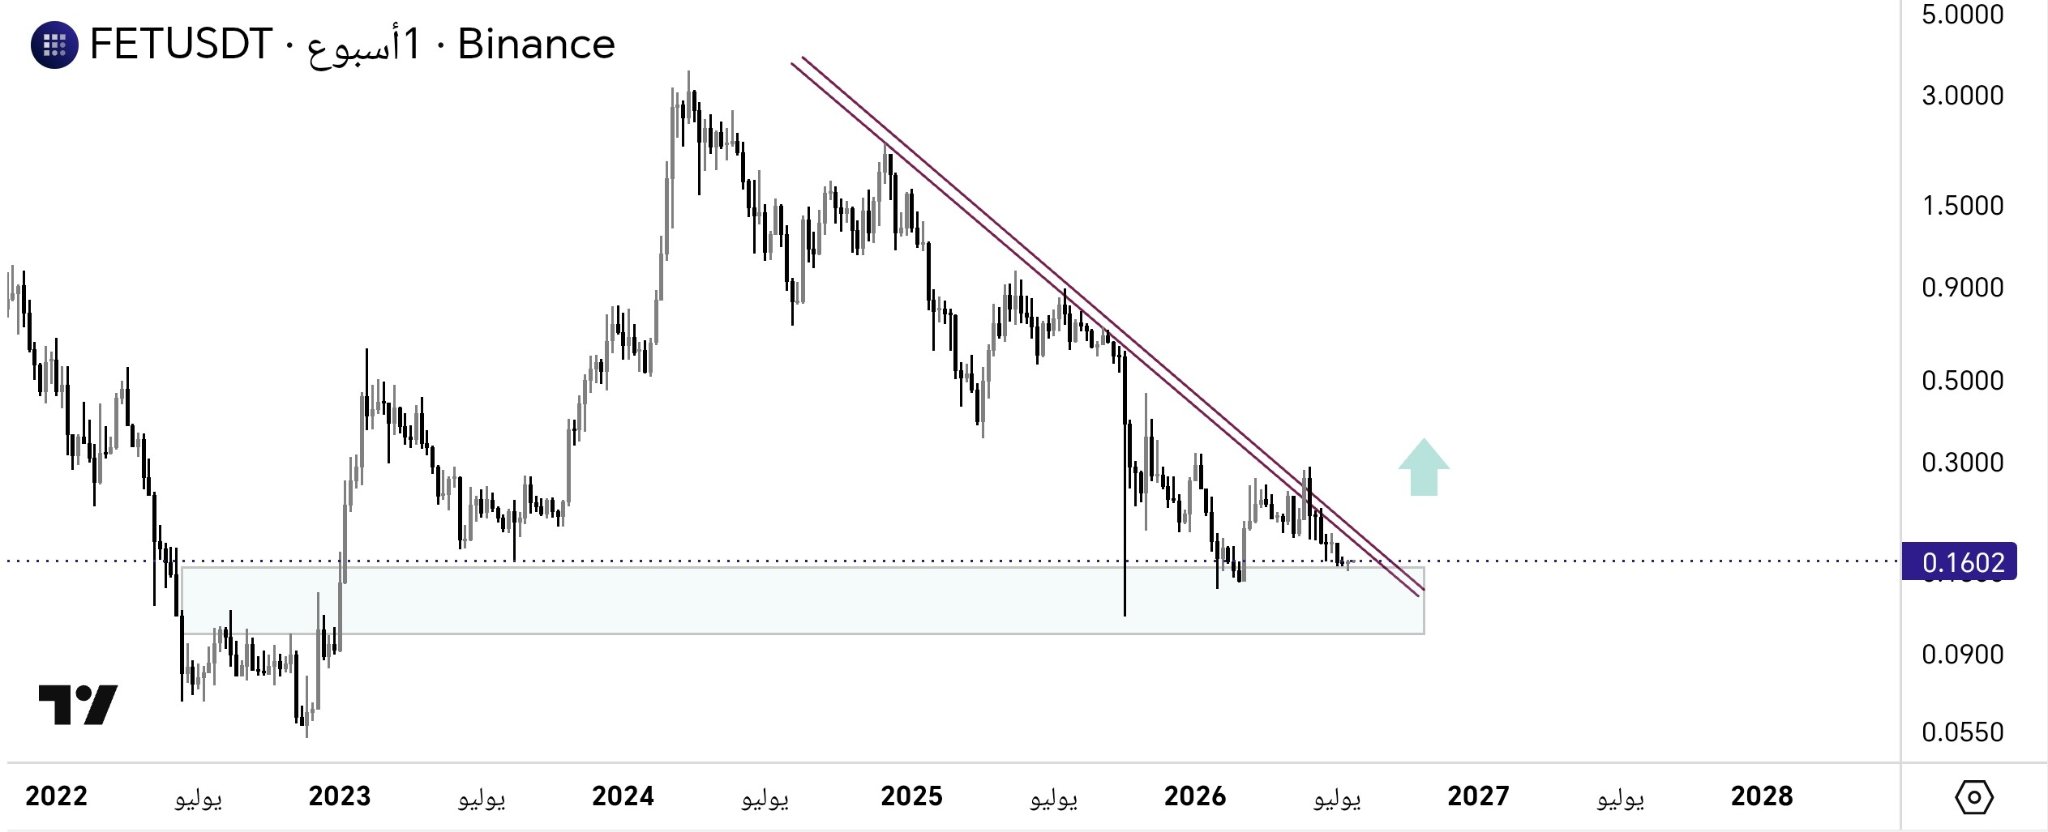
    #FET | $FET For people who ask whether the coin will rise to $5 We should be realistic: such an increase is impossible in the medium term You have a strong downtrend on the weekly chart; if it breaks, we could target $0.50 then $1.00 Start trading today with the best platform #Binance https://t.co/UeLFwB41eq

    AYMAN TA_Analyst Trader S
     3.75K  @Crypto_Ayman

    $FET... 📈

     110  5  10.51K
    Оригинал >
    Тренд FET после выпуска
     Медвежий
    FET is unlikely to reach $5 in the medium term; it needs to break the weekly downtrend line before aiming for $0.5‑$1.
  • AYMAN TA_Analyst Trader S
     3.75K  @Crypto_Ayman

    $FET... 📈

     107  3  17.14K
    Оригинал >
    Тренд FET после выпуска
     Бычий
    FET is unlikely to reach $5 in the medium term; it needs to break the weekly downtrend line before aiming for $0.5‑$1.
  • AYMAN TA_Analyst Trader S
     3.75K  @Crypto_Ayman

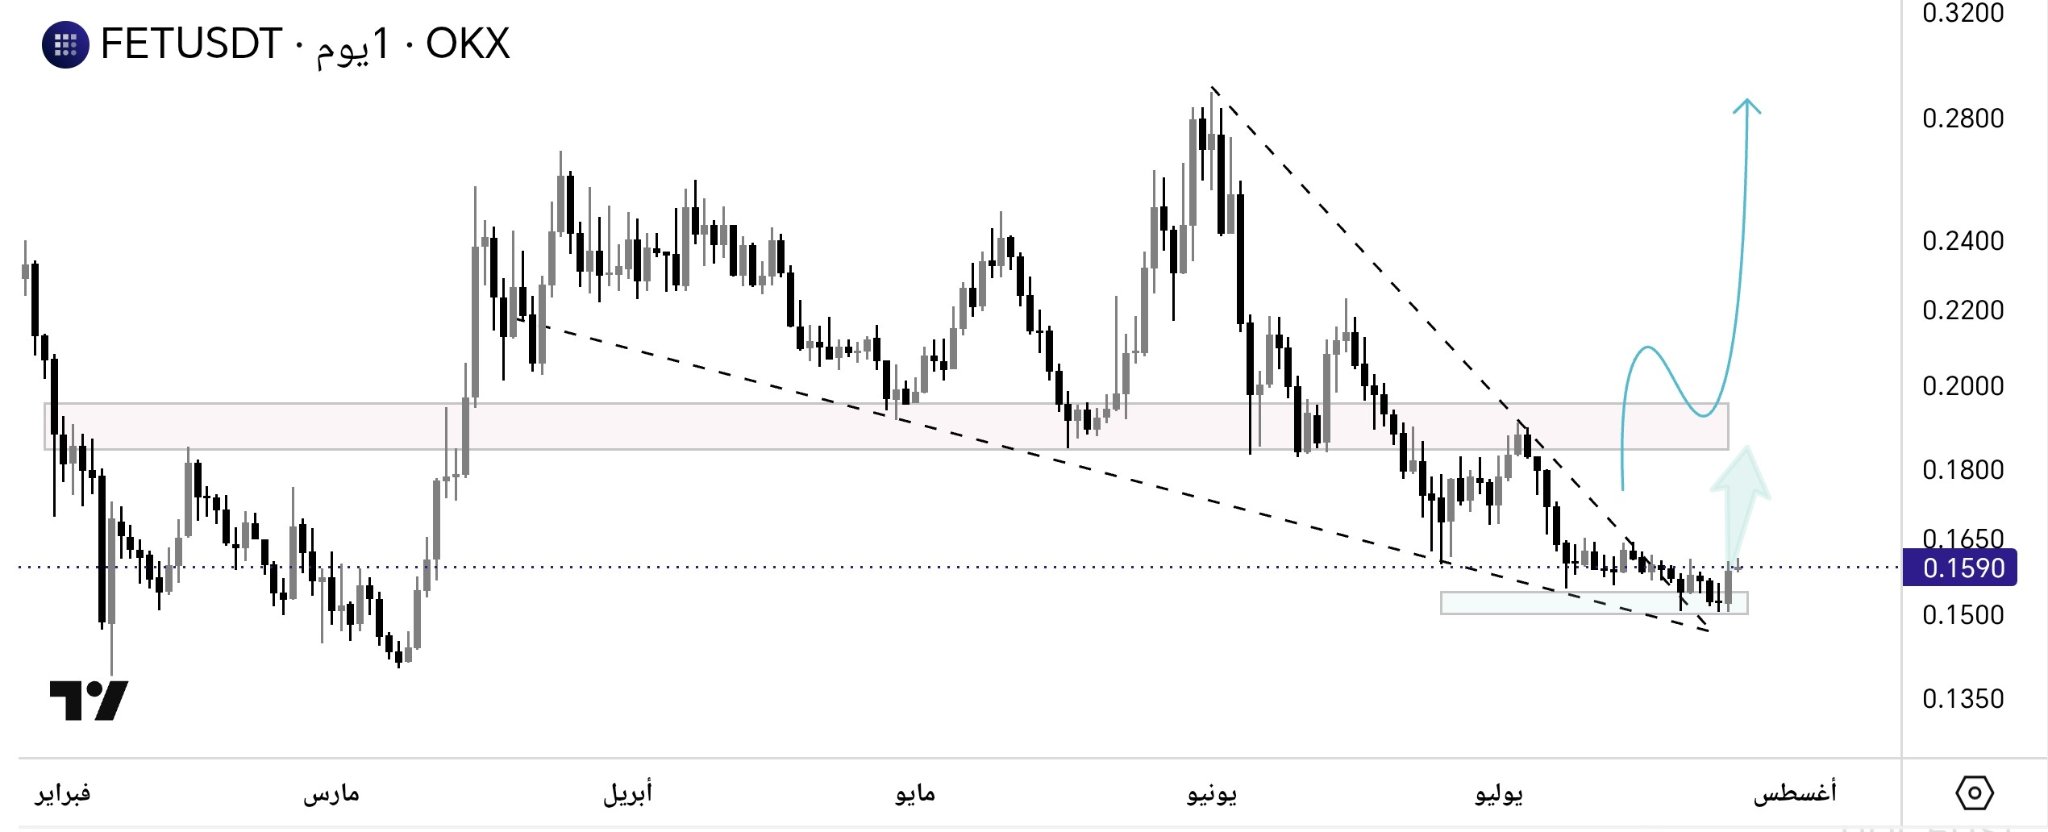
    #FET | $FET As long as the price stays above the breakout target area, the red box is the biggest reversal zone The red box is the largest reversal zone 🚀 https://t.co/CYDhJUtBCx

    AYMAN TA_Analyst Trader S
     3.75K  @Crypto_Ayman

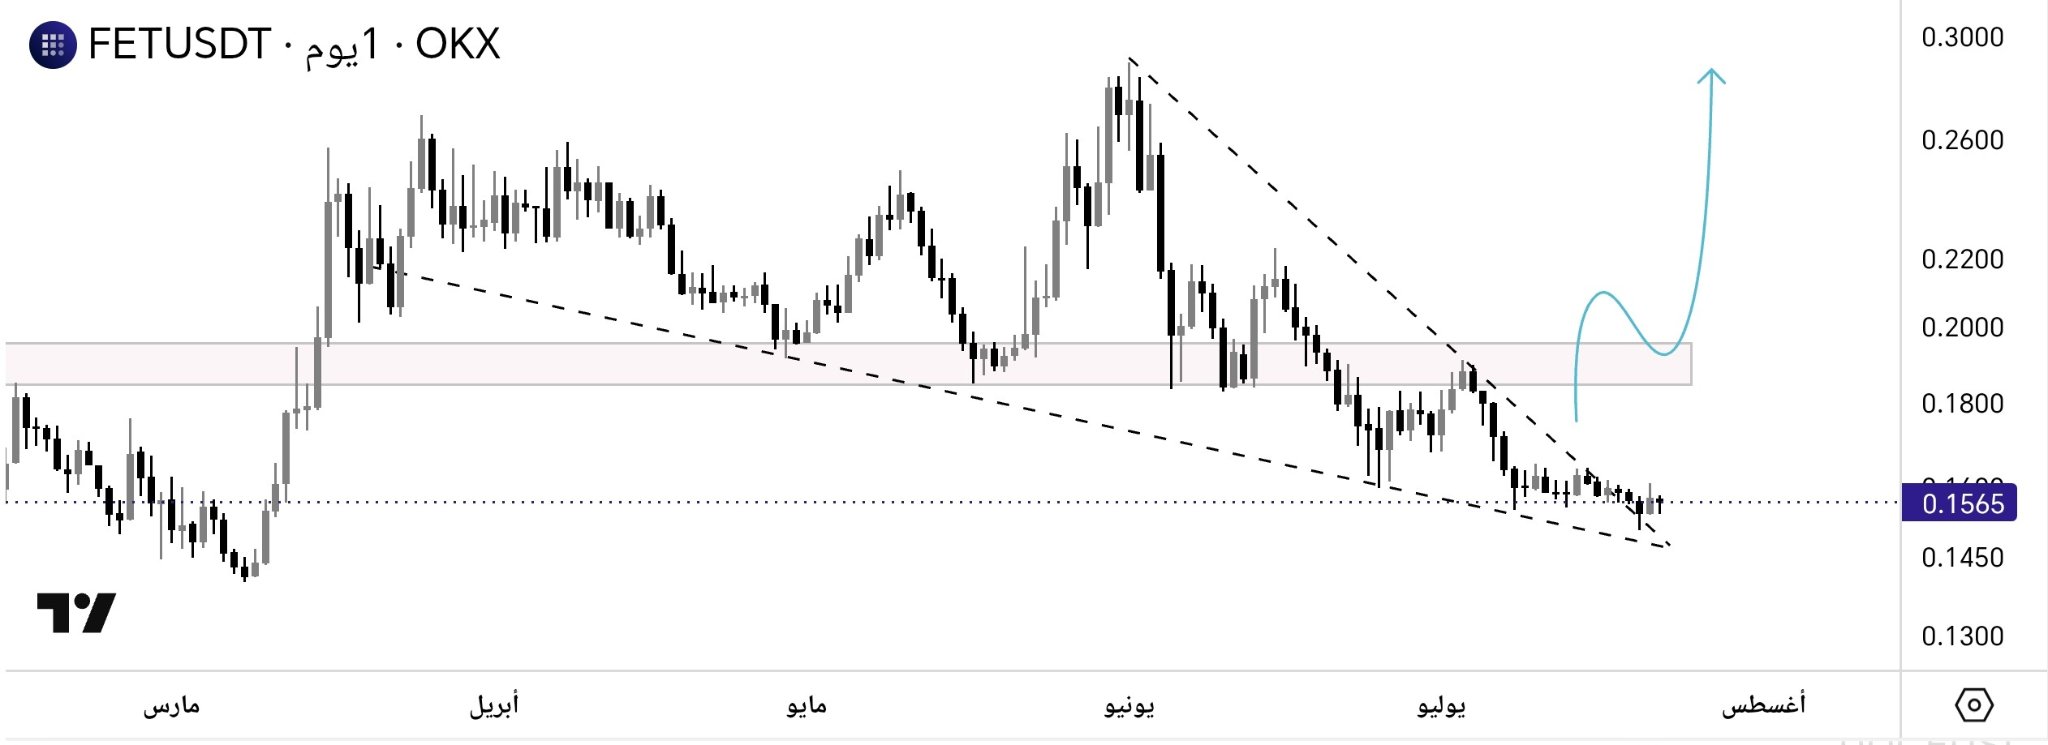
    #FET | $FET The break of the steady descending wedge is an opportunity for an upward move .. 📡 And the next hurdle is the red box https://t.co/Tn5mYAplGA

     93  4  9.10K
    Оригинал >
    Тренд FET после выпуска
     Чрезвычайно бычий
    FET breaks out of a descending wedge, expected to surge significantly to a key red zone.
  • AYMAN TA_Analyst Trader S
     3.75K  @Crypto_Ayman
    AYMAN TA_Analyst Trader S
     3.75K  @Crypto_Ayman

    #FET | $FET The break of the steady descending wedge is an opportunity for an upward move .. 📡 And the next hurdle is the red box https://t.co/Tn5mYAplGA

     76  5  19.21K
    Оригинал >
    Тренд FET после выпуска
     Бычий
    FET breaks the descending wedge, indicating an upward opportunity, with the next resistance in the red box area shown in the chart.