
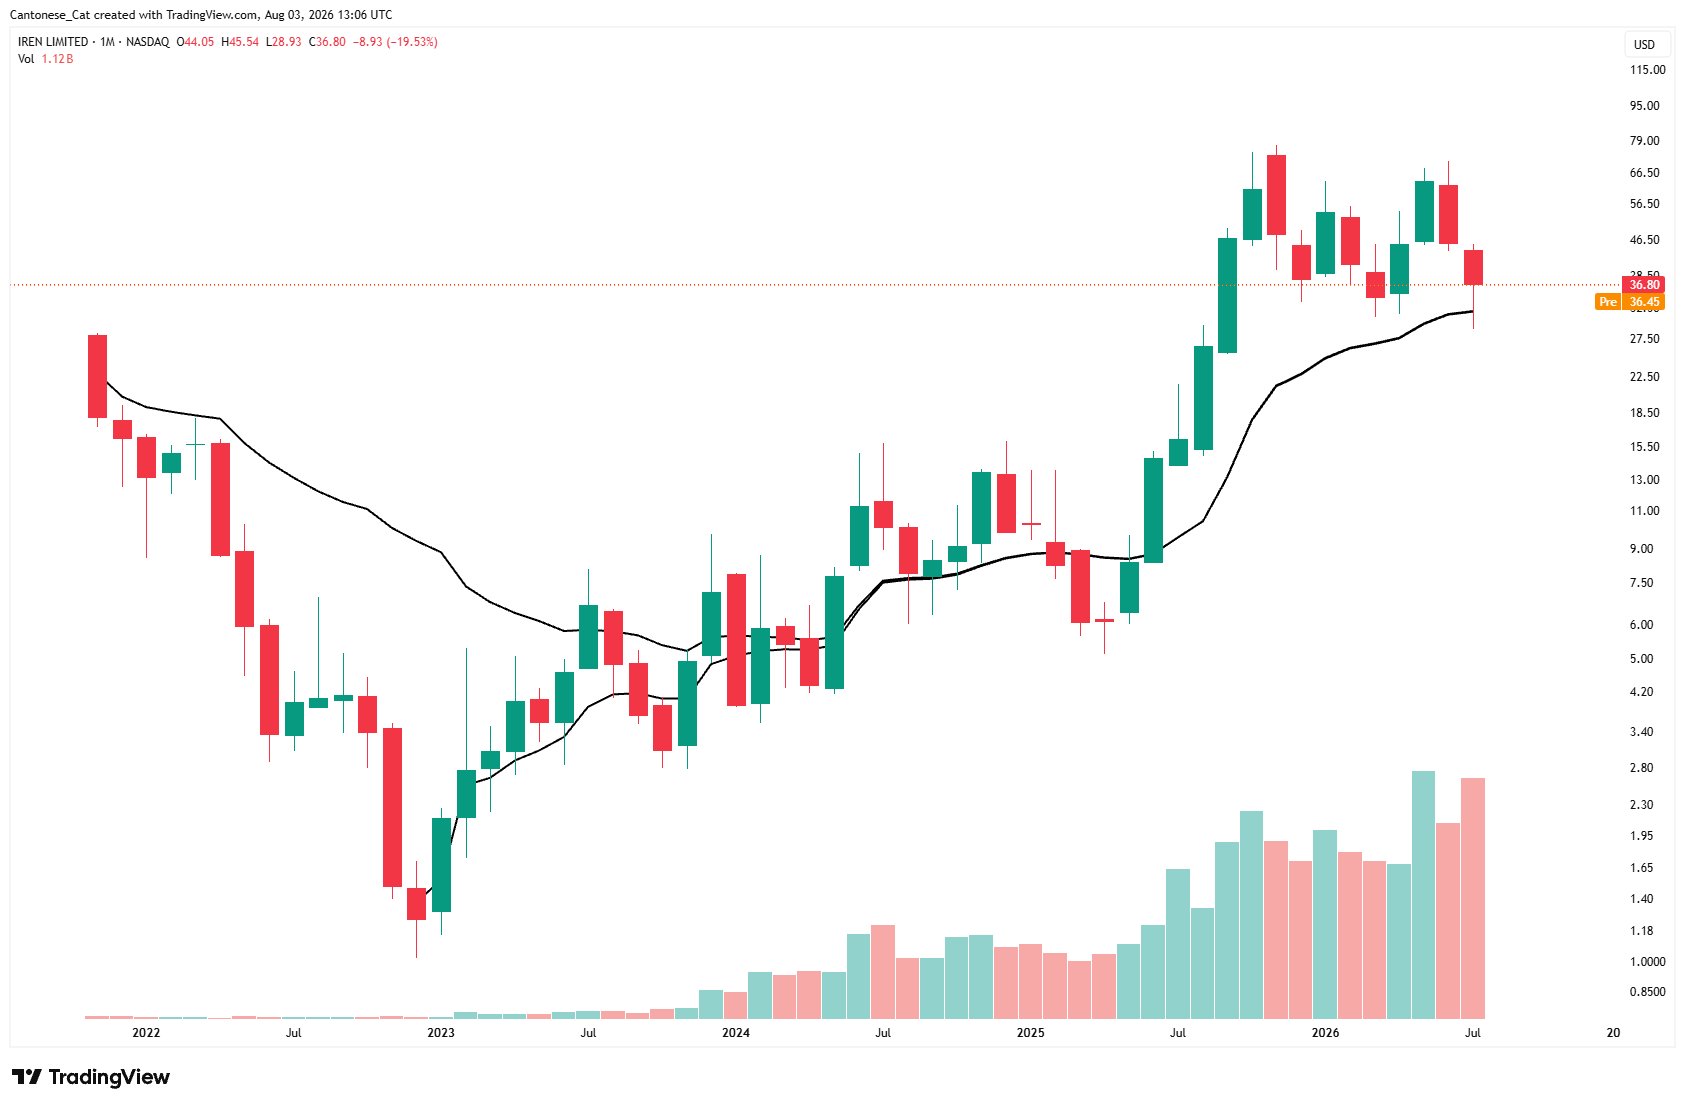
$IREN survived the AVWAP support anchored from IPO and anchored rom all time low with a huge volume absorption in July 2026. https://t.co/ECUmeFwMVQ


 91.1K @cantonmeow
 $IREN survived the AVWAP support anchored from IPO and anchored rom all time low with a huge volume absorption in July 2026. https://t.co/ECUmeFwMVQ
 54
54
 3
3
 7.7K
7.7K
 6.2K @Pivot922
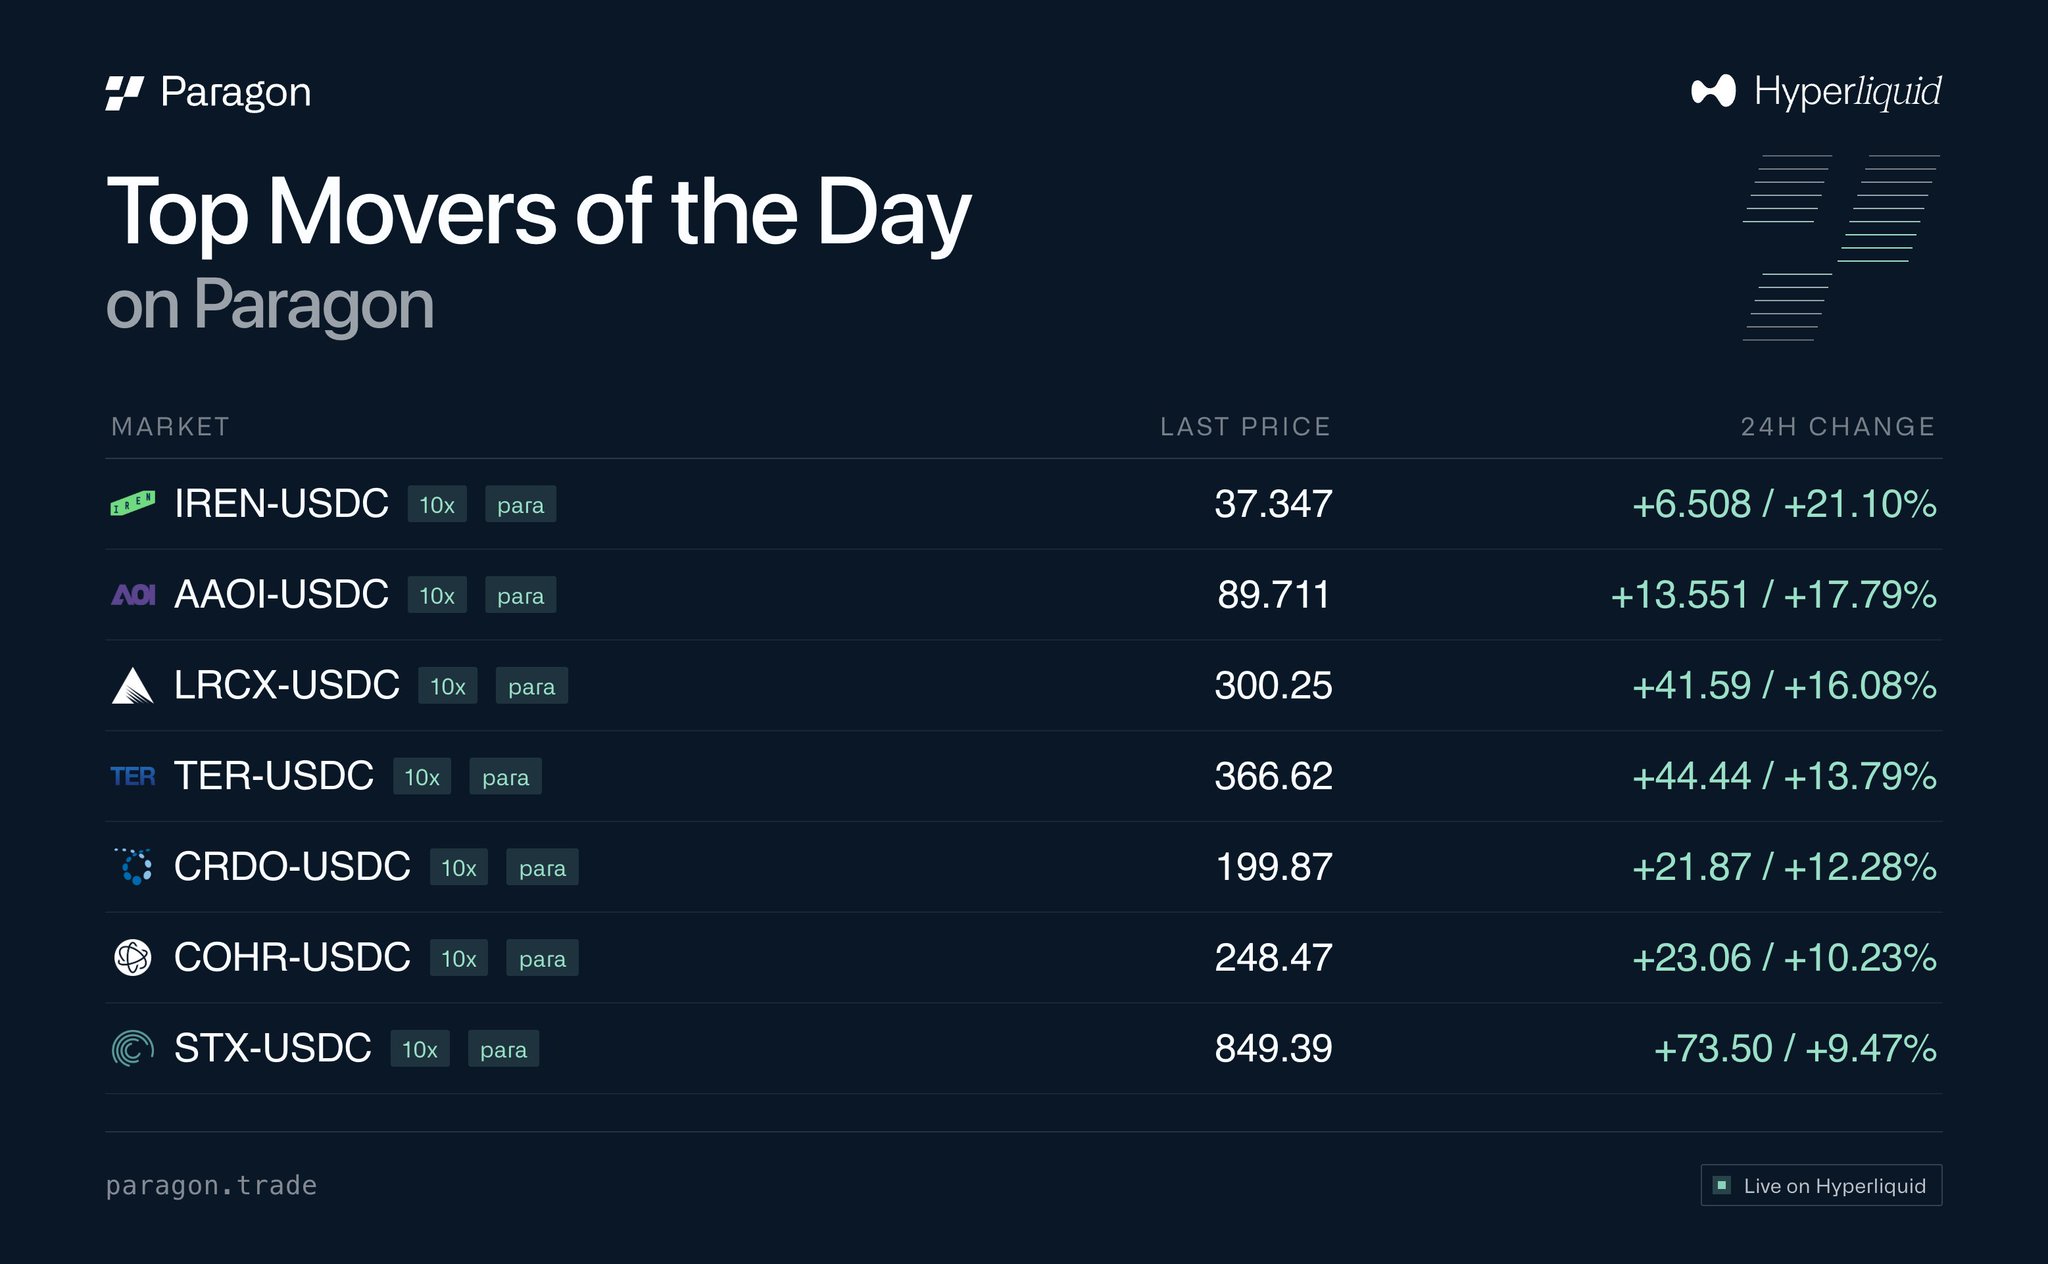
 Looks like Paragon is going in on tickers
 2.7K @tradeparagon
 Top Movers of the Day. https://t.co/hxEvinWElL
 5
0
1.5K
5
0
1.5K
 23.2K @chad_ventures
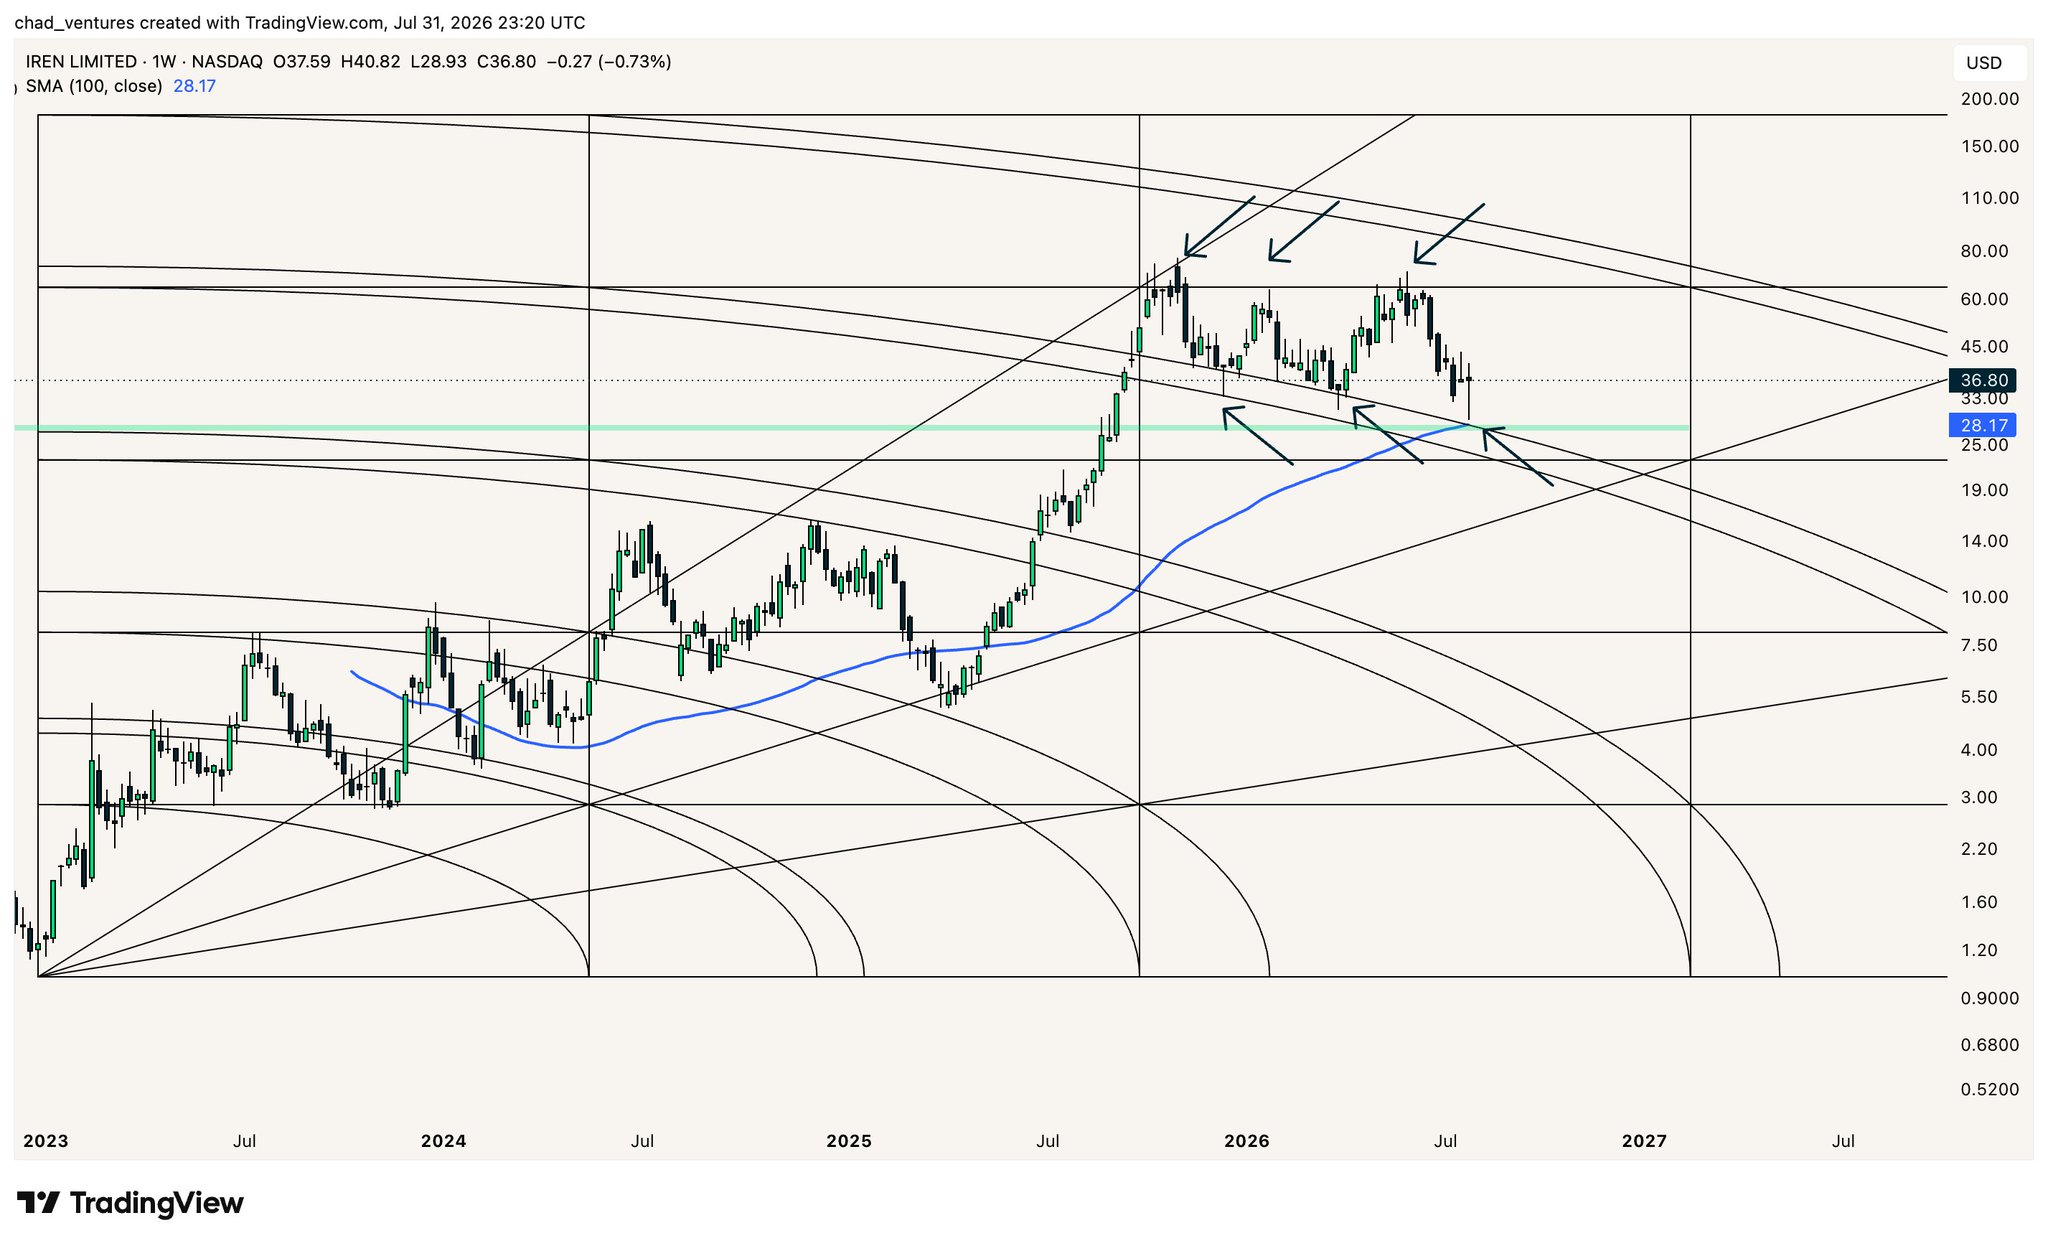
 $IREN Horizontal around $69 - the level to break also on that weekly Gann Square chart for $100+ to happen
Lower bound of the right-angled descending broadening wedge perfectly aligns with the confluence zone consisting of the 100-week moving average and the Gann arc. Underlines that this is the zone to hold to avoid a loss of support and also a wedge breakdown
 23.2K @chad_ventures
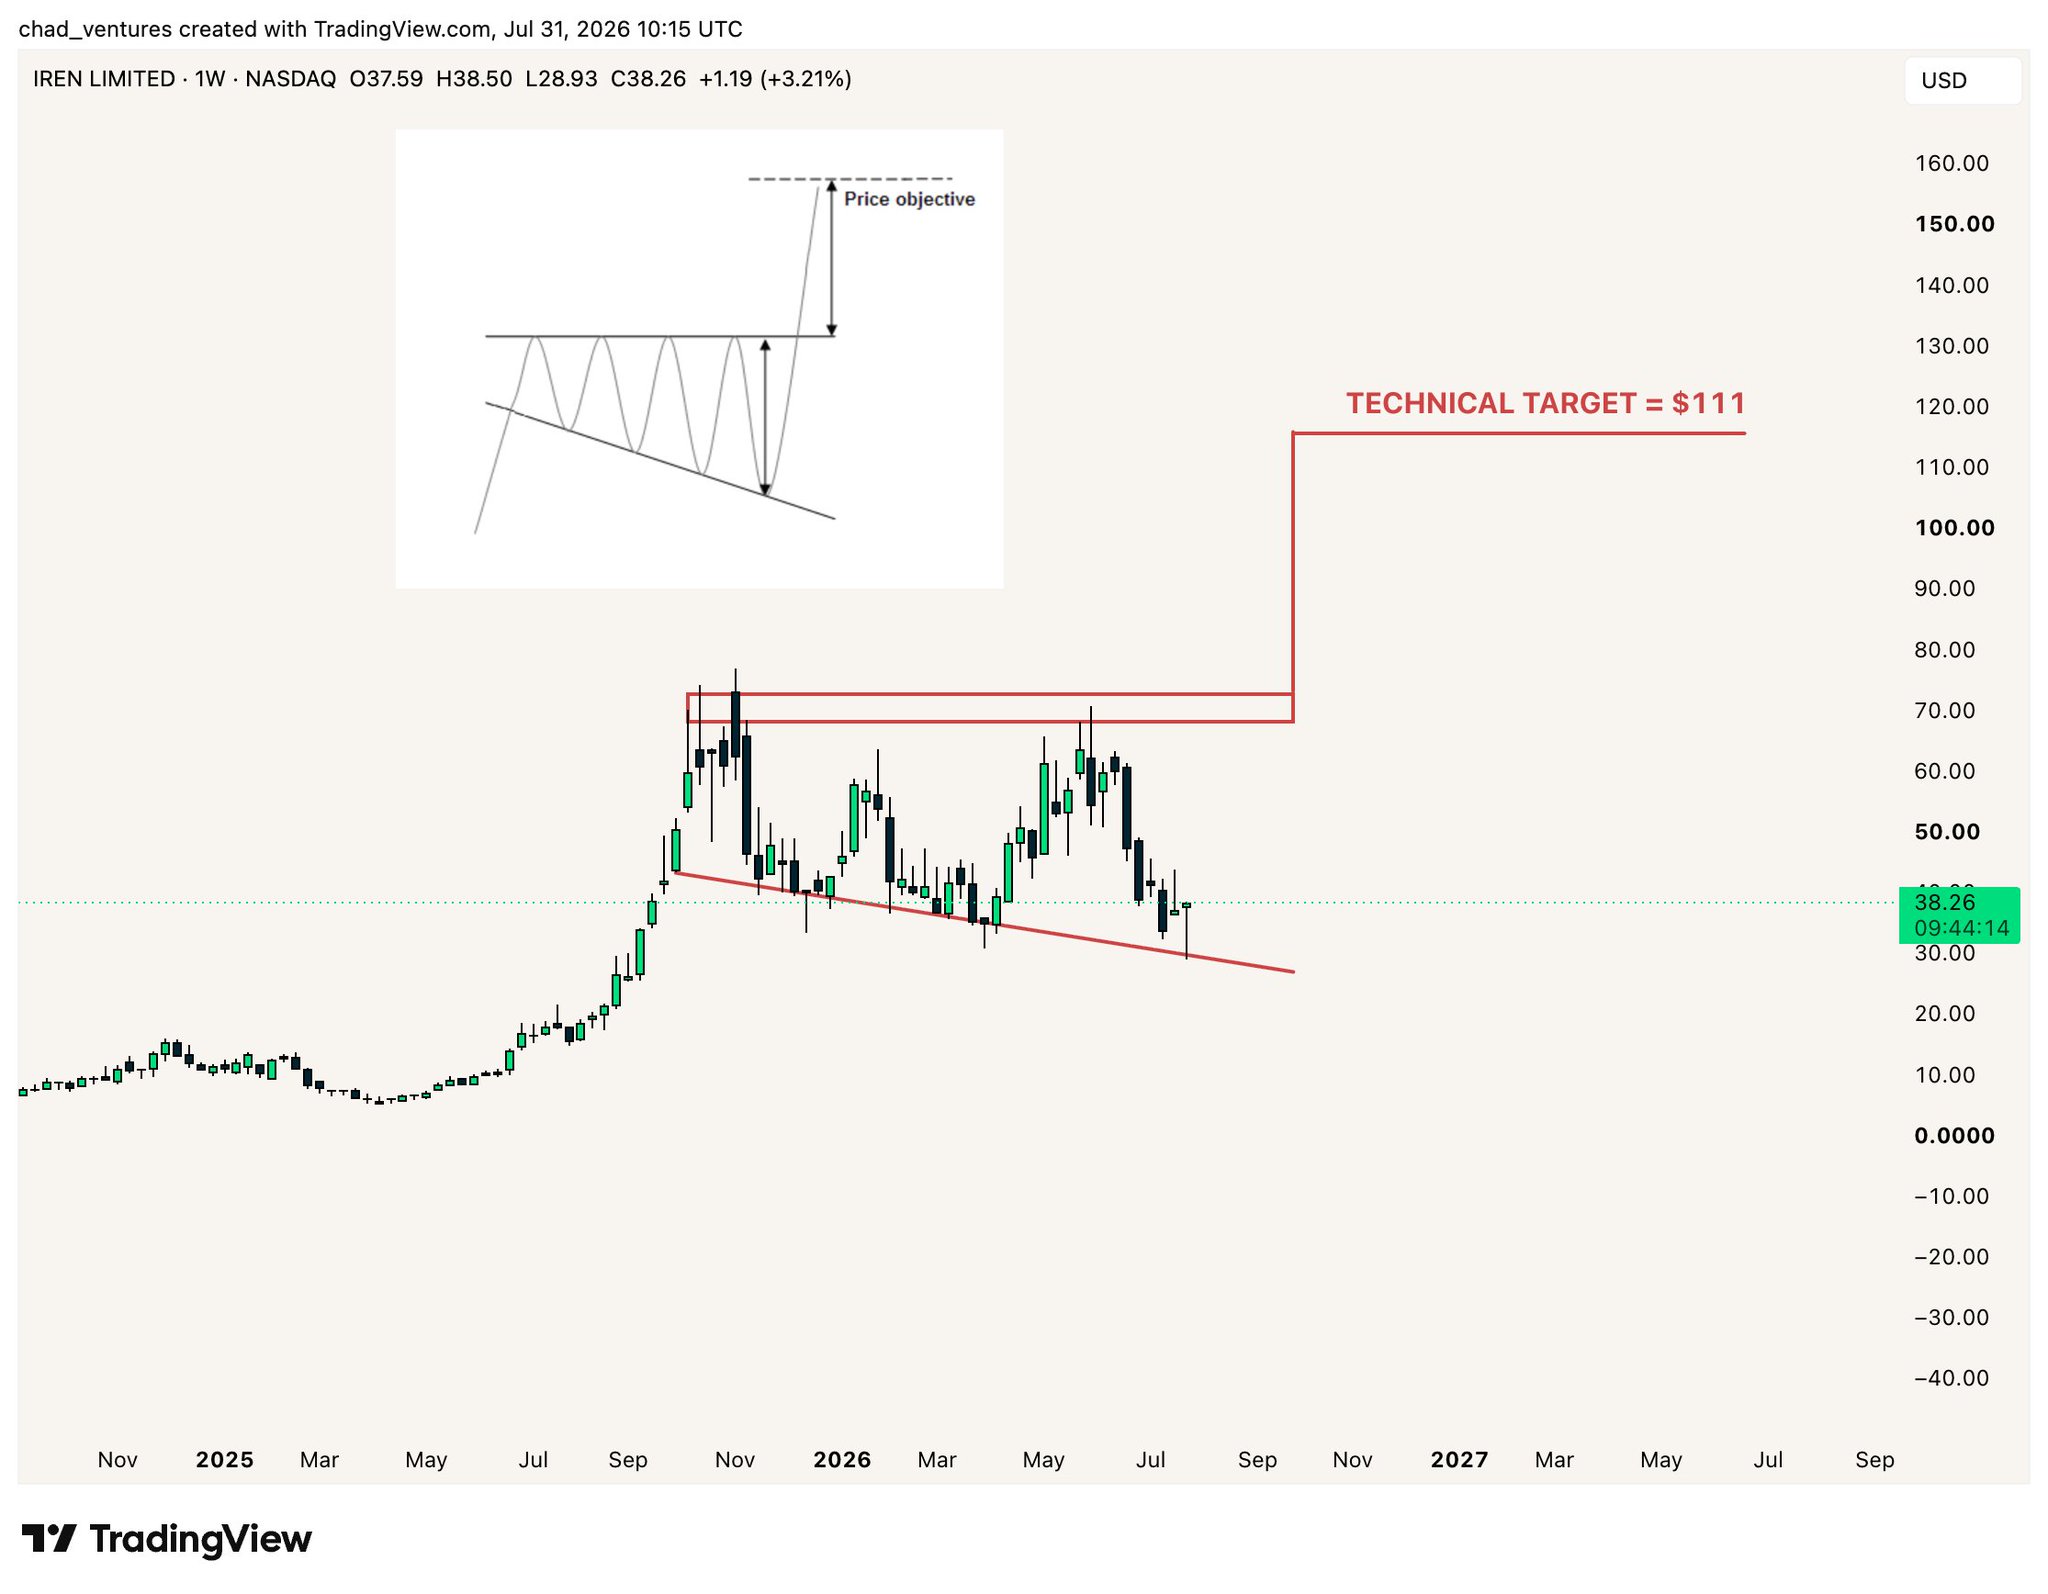
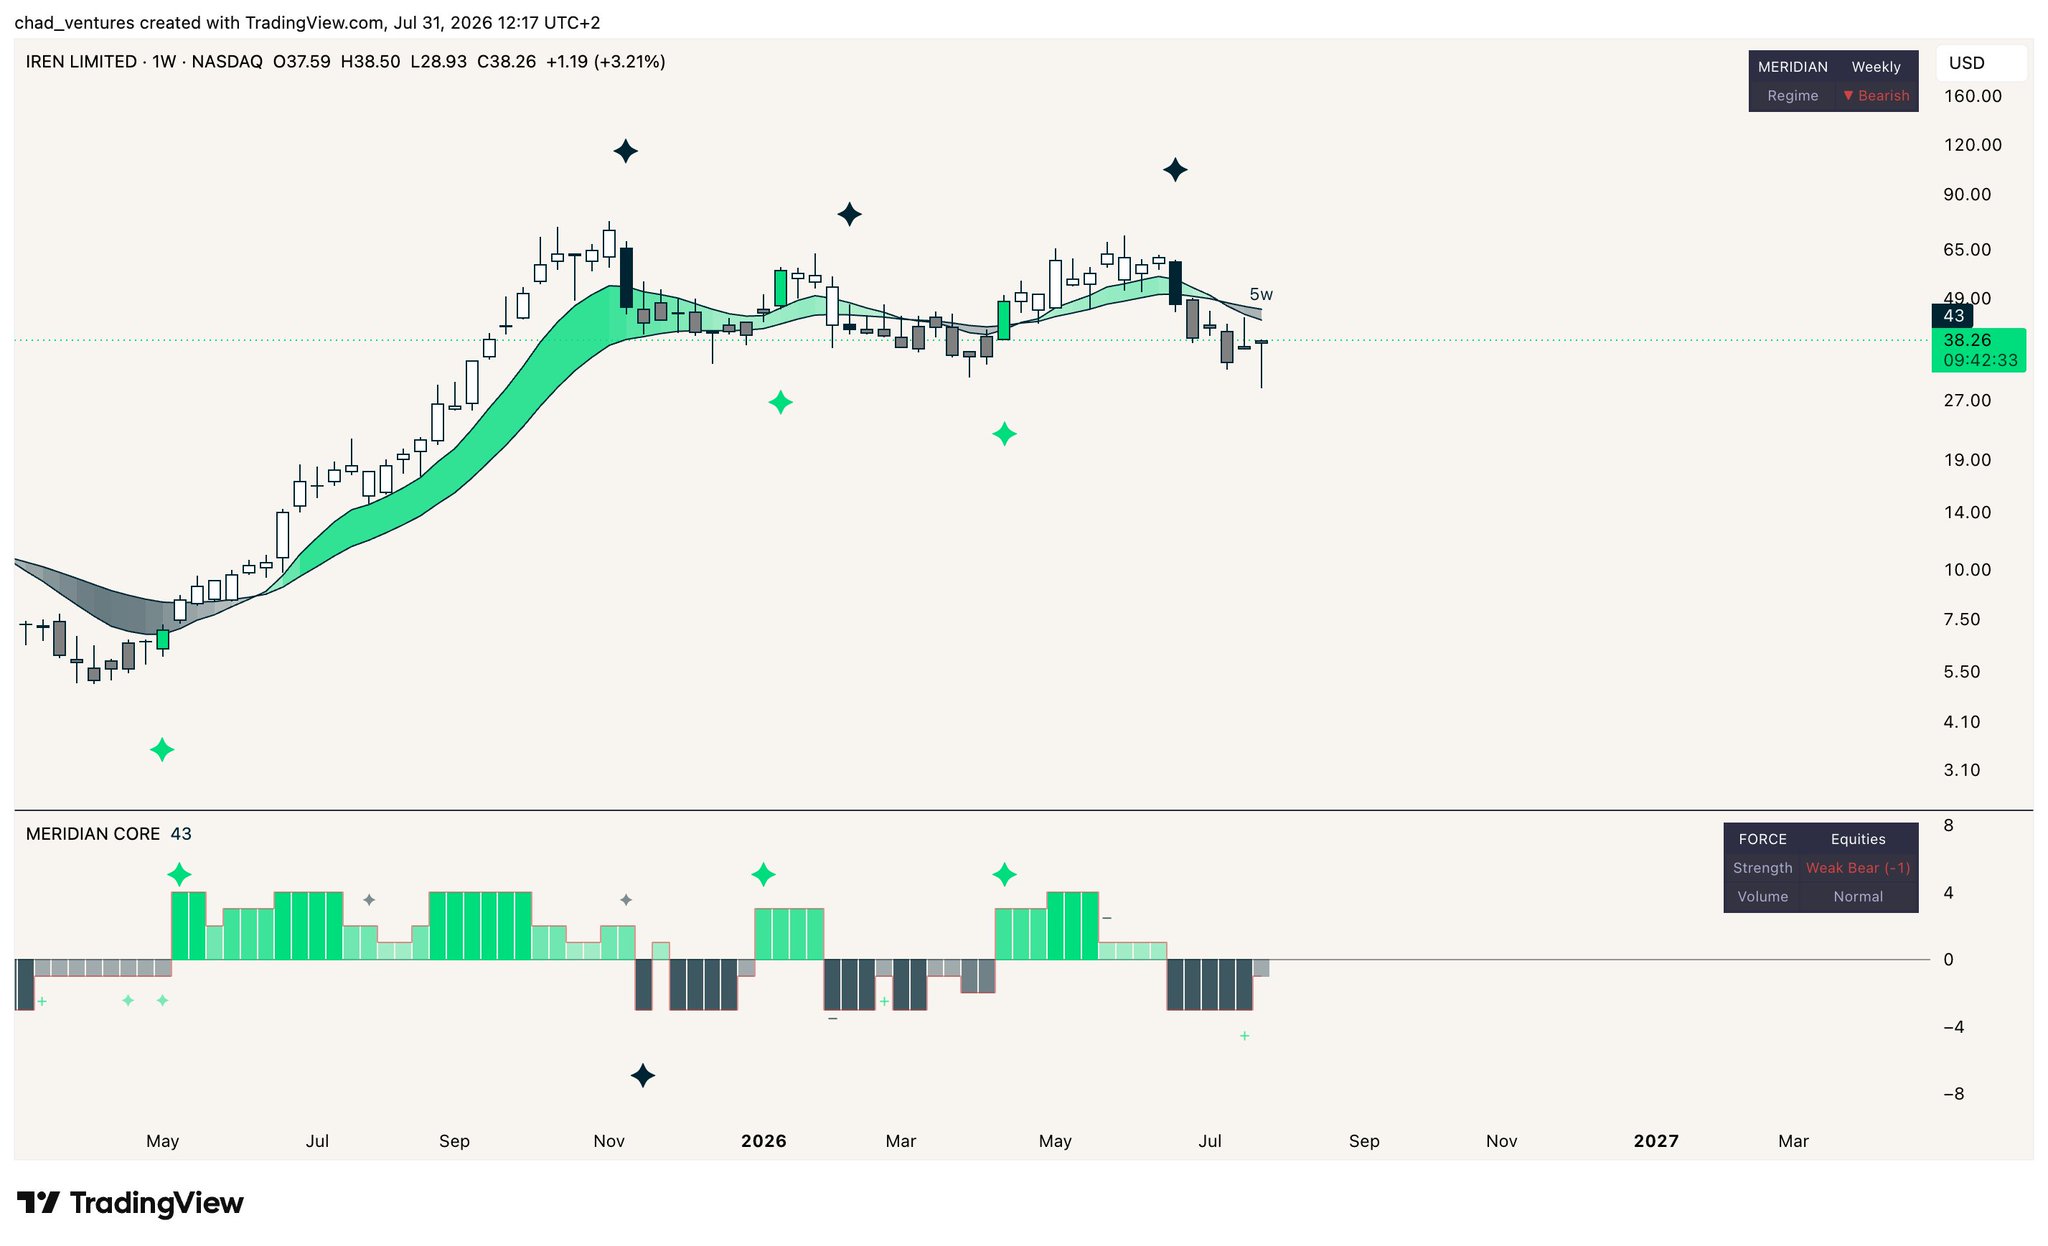
 $IREN is potentially forming a right-angled descending broadening wedge.
This is a bullish continuation setup.
If price resumes the uptrend now and breaks out above the horizontal resistance around $69, the technical target would be around $111.
Momentum is not present just yet, as indicated by the https://t.co/CfqnanHnGv, which has not yet printed a renewed North Star bullish signal on the main panel, while the FORCE indicator is also still bearish.
Momentum needs to pick up again for that pattern to play out.
 85
7
13.2K
85
7
13.2K
