Fangen Sie an.
Zum Herunterladen scannen
iOS und Android
BitMart / Krypto / RGTI

Rigetti Computing Tokenized Stock (Robinhood) (RGTI)

$
$ 18.74 (RGTI/USD)
0.59%
24H

Rigetti Computing Tokenized Stock (Robinhood) Live Kursdaten

Der heutige Preis von Rigetti Computing Tokenized Stock (Robinhood) ist $ 18.74 (RGTI/USD). Mit einer Marktkapitalisierung von $ 5,588.96 USD. 24-Stunden-Handelsvolumen von $ 0 USD, Eine 24-Stunden-Preisänderung von +0.59%, Sowie einer Umlaufmenge von 298.24 RGTI.

Rigetti Computing Tokenized Stock (Robinhood) RGTI Preisverlauf USD

Verfolgen Sie den Preis von Rigetti Computing Tokenized Stock (Robinhood) für heute, 7 Tage, 30 Tage und 90 Tage
Zeitraum
Ändern
Veränderung (%)
Heute
$ 0.10
0.59%
7Tage
$ 0.29
1.62%
30Tage
$ 0.29
1.62%
90Tage
$ 0.29
1.62%

Besitzen Sie RGTI jetzt

Kaufen und verkaufen Sie RGTI einfach und sicher auf BitMart.
Jetzt RGTI kaufen/verkaufen
Jetzt {0} kaufen/verkaufen
Rigetti Computing Tokenized Stock (Robinhood) Marktinformationen
Letzter Preis $ 18.74
$ 18.63 24-Std.-Bereich $ 18.79
Allzeithoch
‎$ 19.33‎
Allzeittief
‎$ 17.63‎
24-Std.-Veränderung
‎0.59%‎
Menge 24 Std.
‎$ 0‎
Zirkulierendes Angebot
298.24 RGTI
Marktobergrenze
‎$ 5,588.96‎
Nettomenge
--
Vollständig verwässerte Marktobergrenze
‎$ 5,588.96‎
Handel RGTI

Verdienen

Setzen Sie Ihre ungenutzten Kryptowährungen ein und erzielen Sie passives Einkommen durch Ersparnisse, Staking und mehr.
Jetzt versuchen
Jetzt versuchen

Rigetti Computing Tokenized Stock (Robinhood) X Insight

avatar
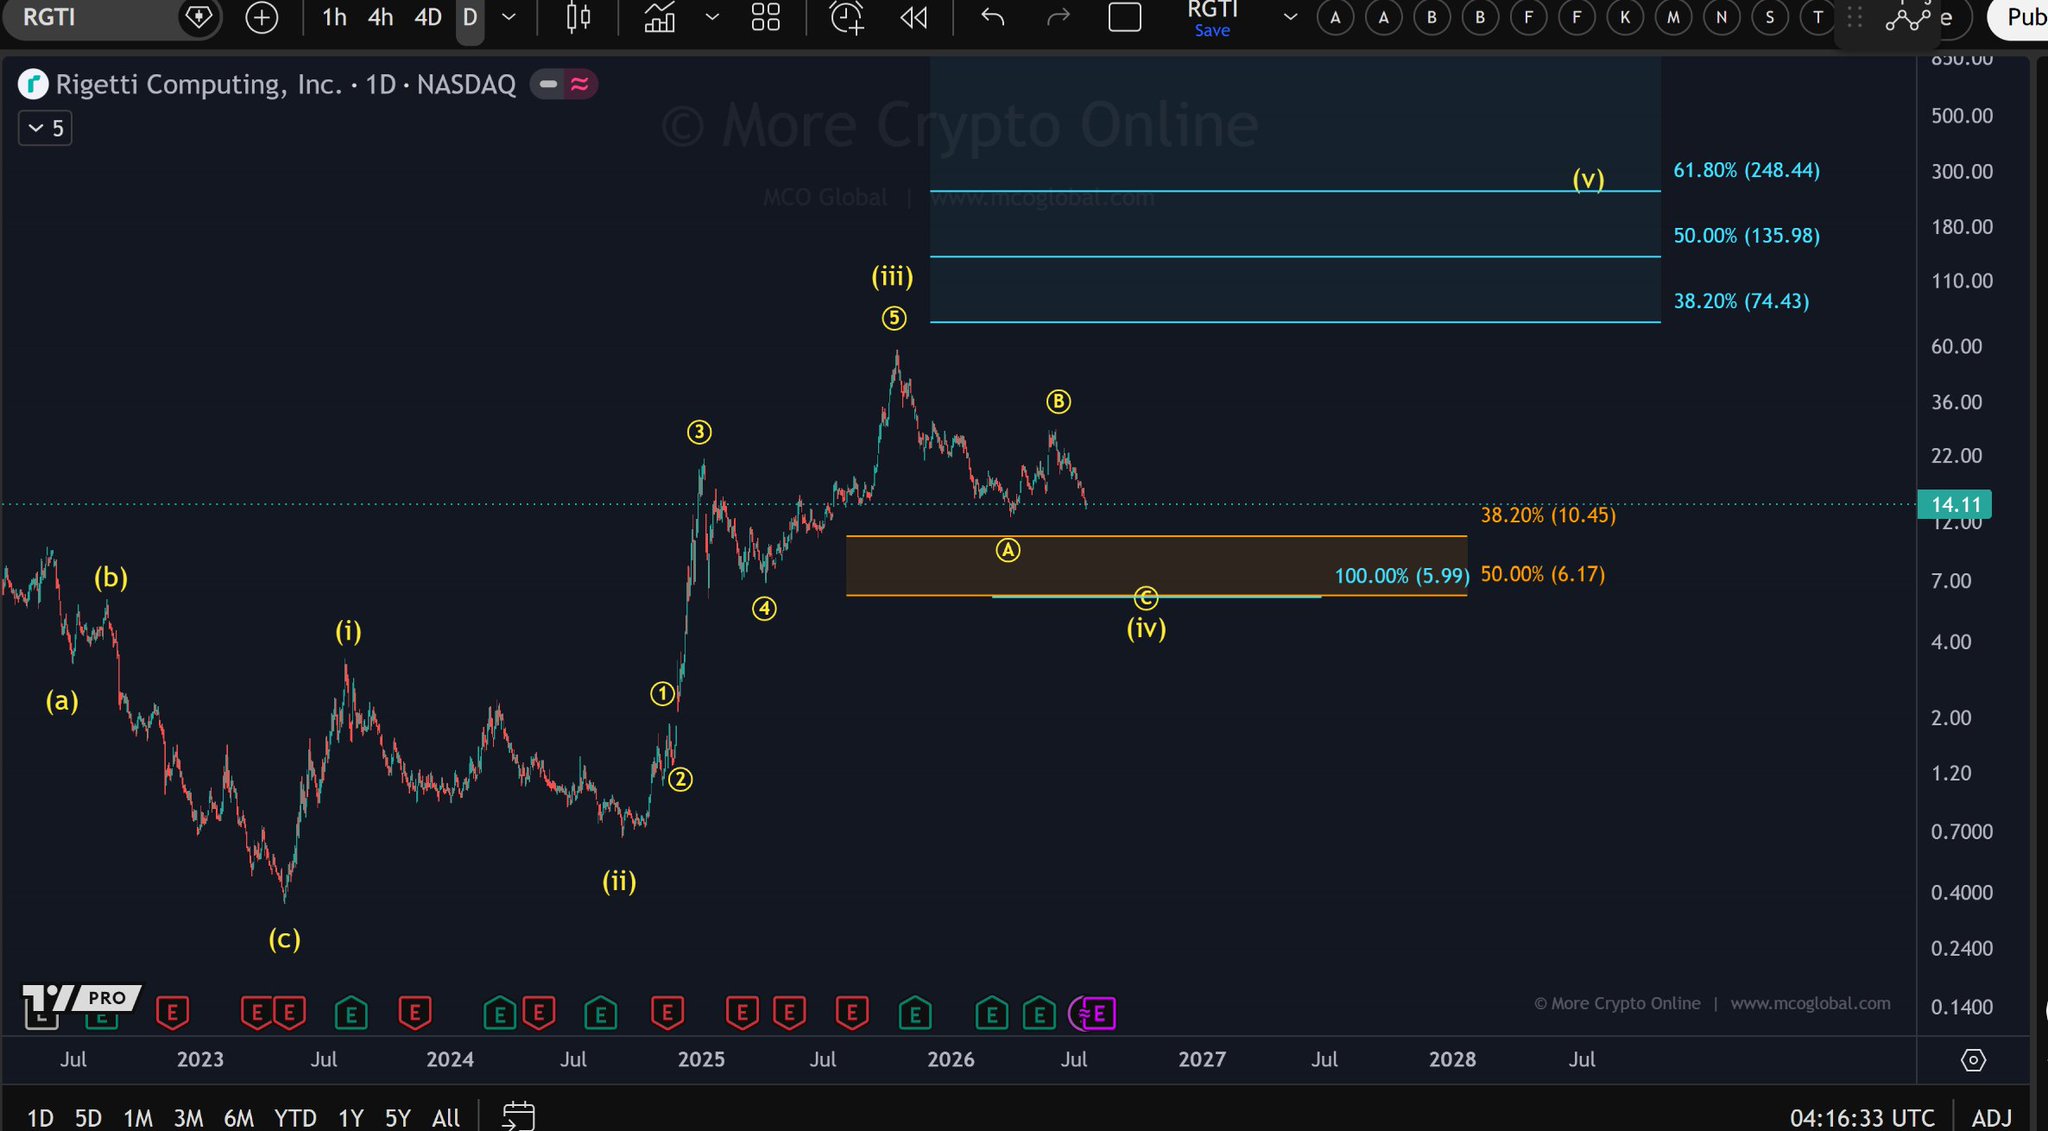
RGTI is in a correction phase, expected to fall to the $5.99-$10.45 support zone.

$RGTI
RGTI remains in a correction phase from the peak of wave (iii), and the move from the peak of wave B still aligns with a still-unfinished decline of wave C.
Leading scenario: The preferred view is that wave (iv) is still incomplete. The decline from the peak of wave B could continue towards the orange support zone between 10,45 $ and 6,17 $, with the 100% C-wave extension around 5,99 $. A move into this area would still fit the structure of the correcting wave (iv) and would not invalidate the count.
Risk scenario: Should the price reverse strongly before reaching the lower support zone and rise back above the recent recovery high, wave (iv) may have completed earlier than expected. On the downside, a sustained break below the 6 $ region would make the correction deeper than ideal and increase the likelihood of a more complex structure.
Key support levels: 10,45 $ / 6,17 $ / 5,99 $ Key resistance levels: 74,43 $ / 136 $ / 248 $ Conclusion: RGTI continues to be viewed as an unfinished (iv) correction wave, with the C-wave decline allowed to extend into the support zone of 10,45 $ to 5,99 $ before a larger (v) wave attempt becomes relevant.
view 22
view 1
view 2.3K
2026-07-18 07:12
Trend von RGTI nach Veröffentlichung
Bärisch
RGTI is in a correction phase, expected to fall to the $5.99-$10.45 support zone.
avatar
RGTI and IONQ gain fresh attention, retail funds shift to quantum AI

🧠 Quantum names $RGTI and $IONQ are pulling fresh attention as retail rotates out of crowded mega-cap AI.

view 7
view 1
view 6.9K
2026-07-07 07:27
Trend von RGTI nach Veröffentlichung
Bullisch
RGTI and IONQ gain fresh attention, retail funds shift to quantum AI
avatar
RGTI is hovering around the $15.30 support level, with a breakout still pending confirmation.

$RGTI
RGTI trades between the next support at $15.30 and the red Fibonacci resistance zone above it. The yellow and blue counts remain fairly balanced, with the proposed wave 1 circle still speculative and should be viewed more as a potential leading diagonal rather than a clear impulse.
Leading scenario: The yellow count can be seen as a possible 1-2 setup, with wave 2 circle still correcting after the rise in May. Holding the area around $15.30 would keep this structure intact, but the next upward attempt needs a stronger reaction before the bullish price gains weight. Risk scenario: Should the $15.30 level give way, the blue ABC interpretation becomes more likely. This would shift focus to the lower red support and possibly the orange support zone, where a C‑wave decline could develop before a larger trend reversal is attempted. Key support levels: $15.30 / ~$12.80 / $10.50–6.20
Key resistance levels: $27.11–49.17
Conclusion: For RGTI there is still no clear advantage between the yellow and blue scenarios. $15.30 is the first level that decides whether the potential 1-2 setup can hold or whether the deeper correction path takes precedence.

view 6
view 1
view 1.8K
2026-07-04 09:12
Trend von RGTI nach Veröffentlichung
Neutral
RGTI is hovering around the $15.30 support level, with a breakout still pending confirmation.
Einzelheiten
Über Rigetti Computing Tokenized Stock (Robinhood)
Rigetti Computing Tokenized Stock (Robinhood) (RGTI) is a cryptocurrency and operates on the Robinhood Chain platform. Rigetti Computing Tokenized Stock (Robinhood) has a current supply of 298.239. The last known price of Rigetti Computing Tokenized Stock (Robinhood) is 17.98088664 USD and is down -3.72 over the last 24 hours. It is currently trading on 11 active market(s) with $0.00 traded over the last 24 hours. More information can be found at https://robinhood.com/us/en/.
Mehr lesen