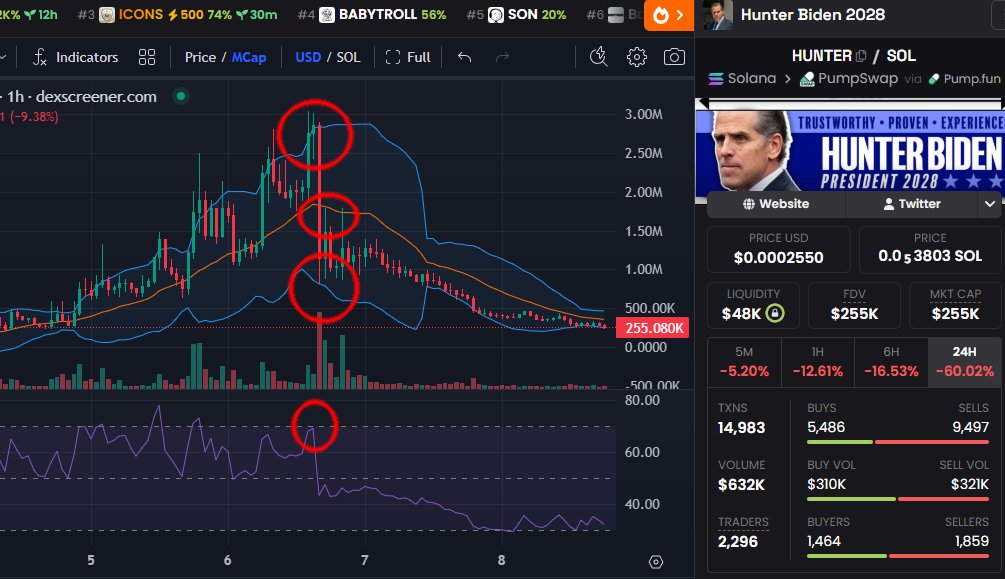
Charts have all a unique story to tell, study the nerdy mean reversal theory, you put the bollinger bands on the chart and check what happens.
Here on the 1H chart $HUNTER crashed because Hunter Biden said he doesn't want to become president, what happens next ?
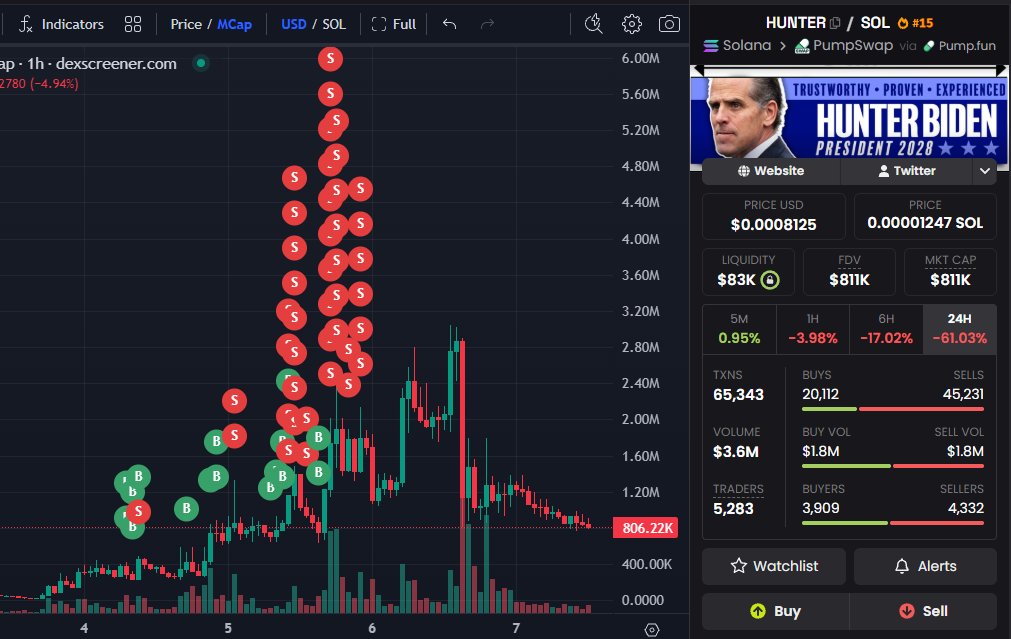
It goes straight to the lower band, then folks start buying there and bots, it pumps back up and where does it stop ? The middle line (the average).
It always come back to the middle line, all the time, Lobstar did the same thing and many many coins also
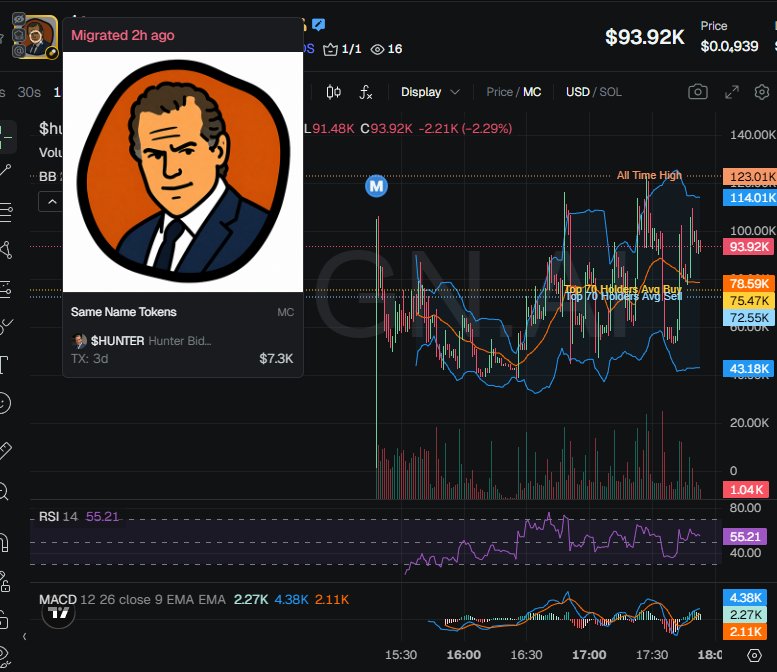
mean reversal means it's always going to a sort of "middle", and bollinger bands show you that middle