Rewards
Futures Daily Draw
100% Chance To Win With Daily Trades
Spot Daily Draw
Win 8,888 USDT In Grand Prizes
Mobile Top-Up
Top up mobiles easily, online, secure
Send
Send money globally, fast and secure
BitMart Mall
Live on crypto

Sei Live Price data
Today's price of Sei Is $ 0.054 (SEI/USD). With A Market Cap Of $ 395.76M USD. 24-Hour Trading Volume Of $ 576.91K USD, A 24-Hour Price Change Of +0.37%, And A Circulating Supply Of 7.22B SEI.
Sei SEI Price History USD
Track the price of Sei for today, 7 days, 30 days and 90 days
Period
Change
Change (%)
Today
$ 0.000099
0.18%
7days
$ 0.00019
-0.36%
30days
$ 0.0088
-13.97%
90days
$ 0.0045
-7.74%
Own SEI Now
Buy and sell SEI easily and securely on BitMart.
Sei Market Information
$ 0.053 24h Range $ 0.056
All time high
$ 1.14
All time low
$ 0.044
24h Change
0.37%
24h Vol
$ 576,907.79
Circulating supply
7.21B
SEI
Market cap
$ 395.76M
Max supply
10.00B
SEI
Fully diluted market cap
$ 548.32M
Trade SEI

Sei X Insight

OCT Trades
TA_Analyst
Trader
B
 5.2K @oct_trades
 Extremely Bullish
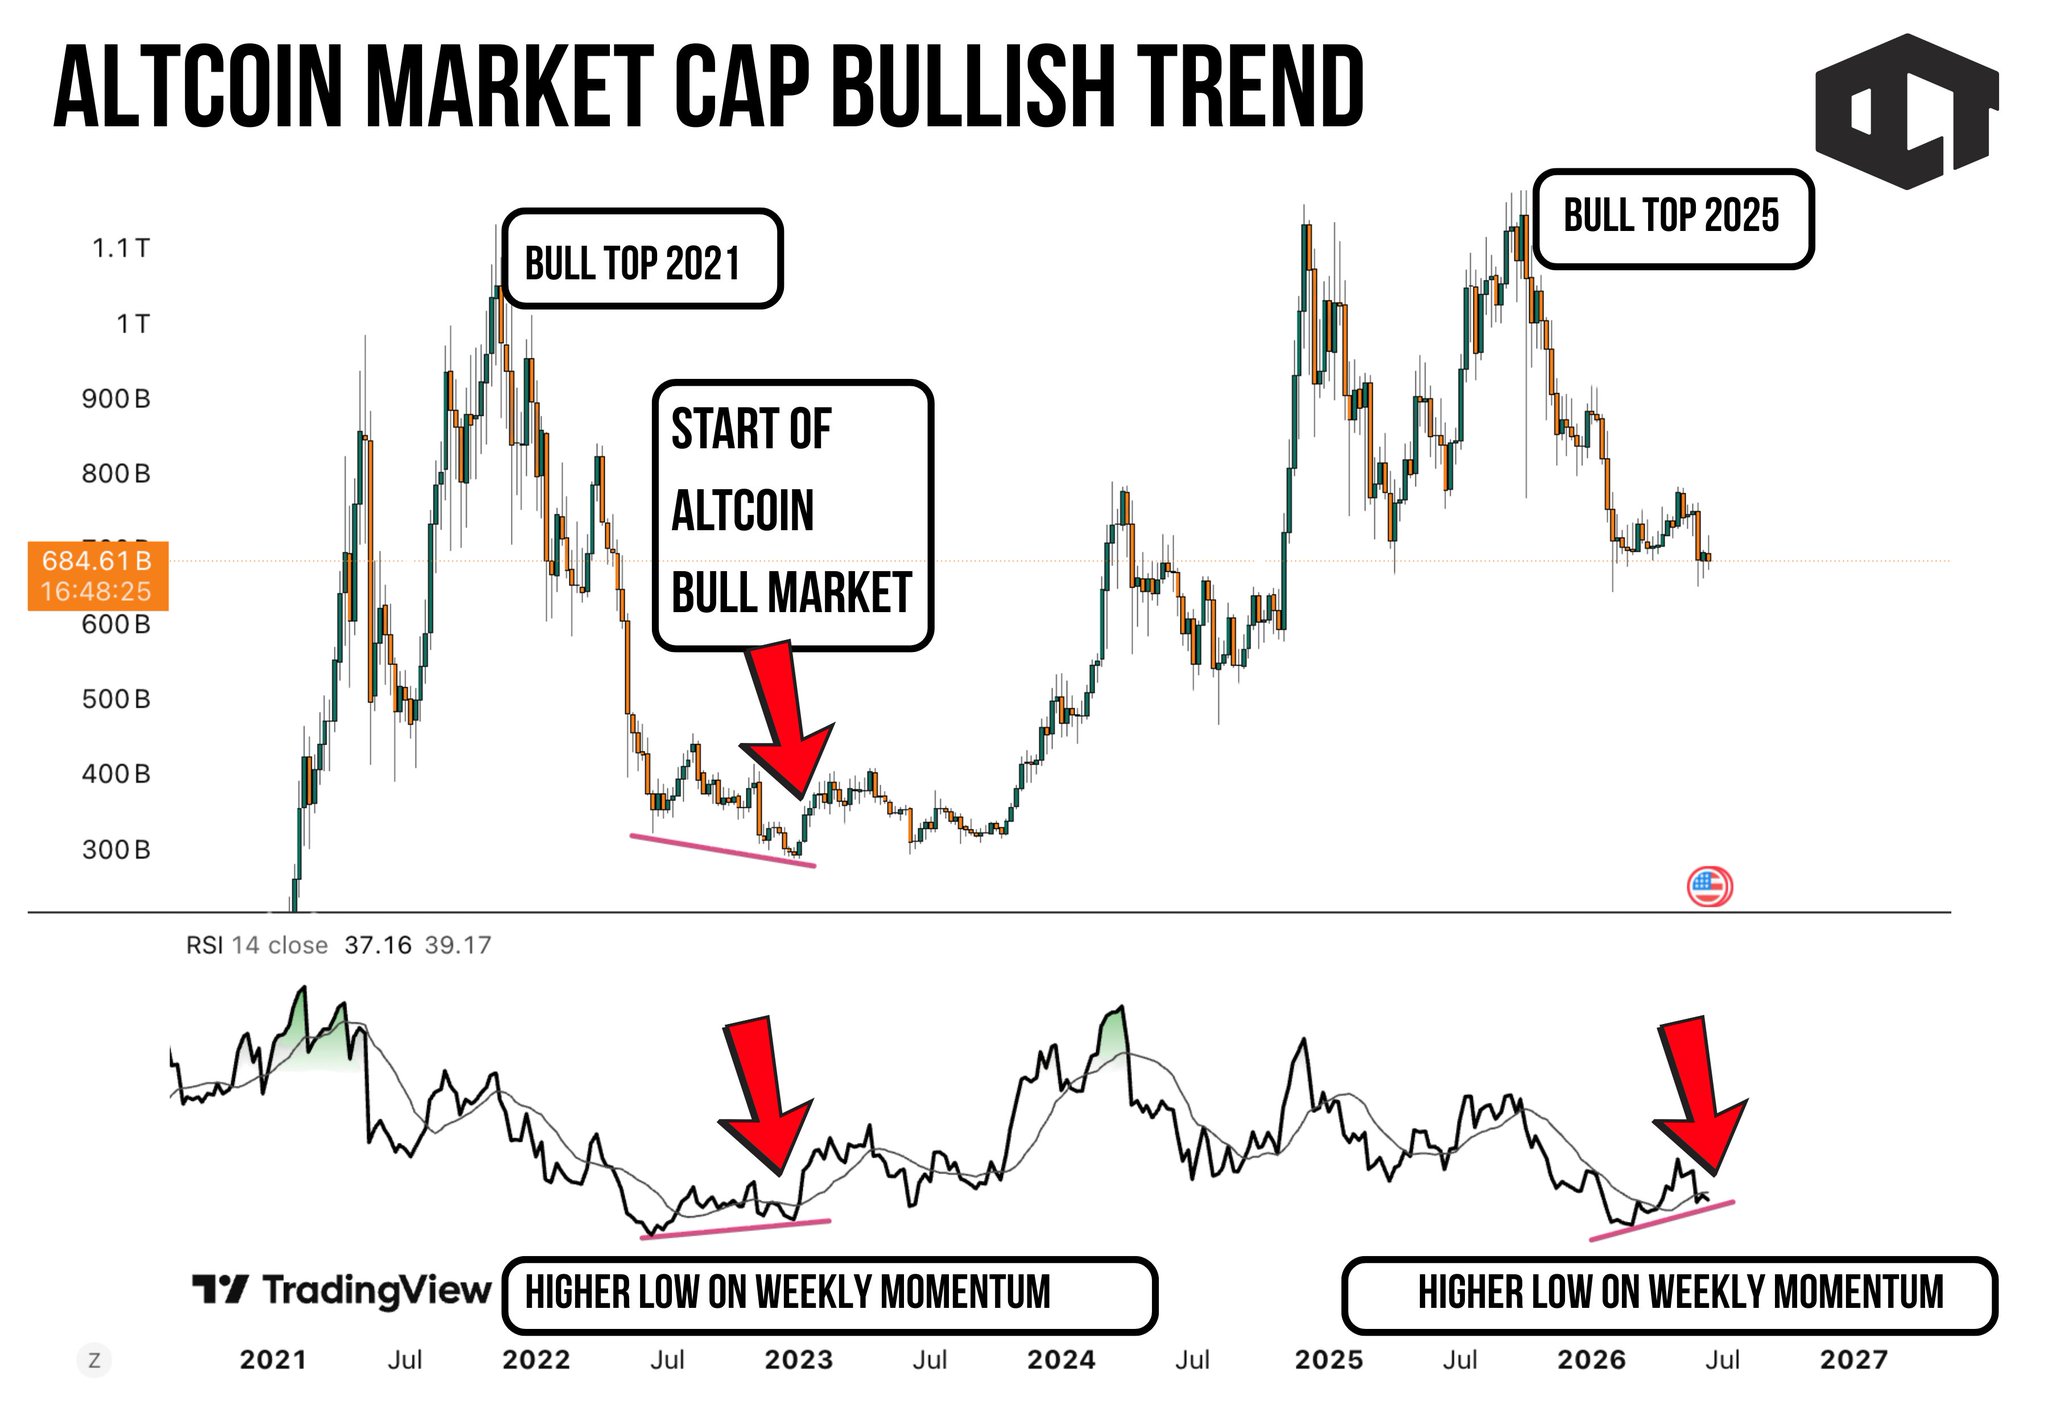
Altcoin market is in a dangerously bullish setup, with weekly momentum RSI forming higher lows, indicating a major recovery.

Our Crypto Talk
Media
OnChain_Analyst
C
79.7K @ourcryptotalk ALTCOINS IN A DANGEROUSLY BULLISH SETUP.
Just like it was after FTX Crash 👀
This gets even better when we see some bottomed charts like :
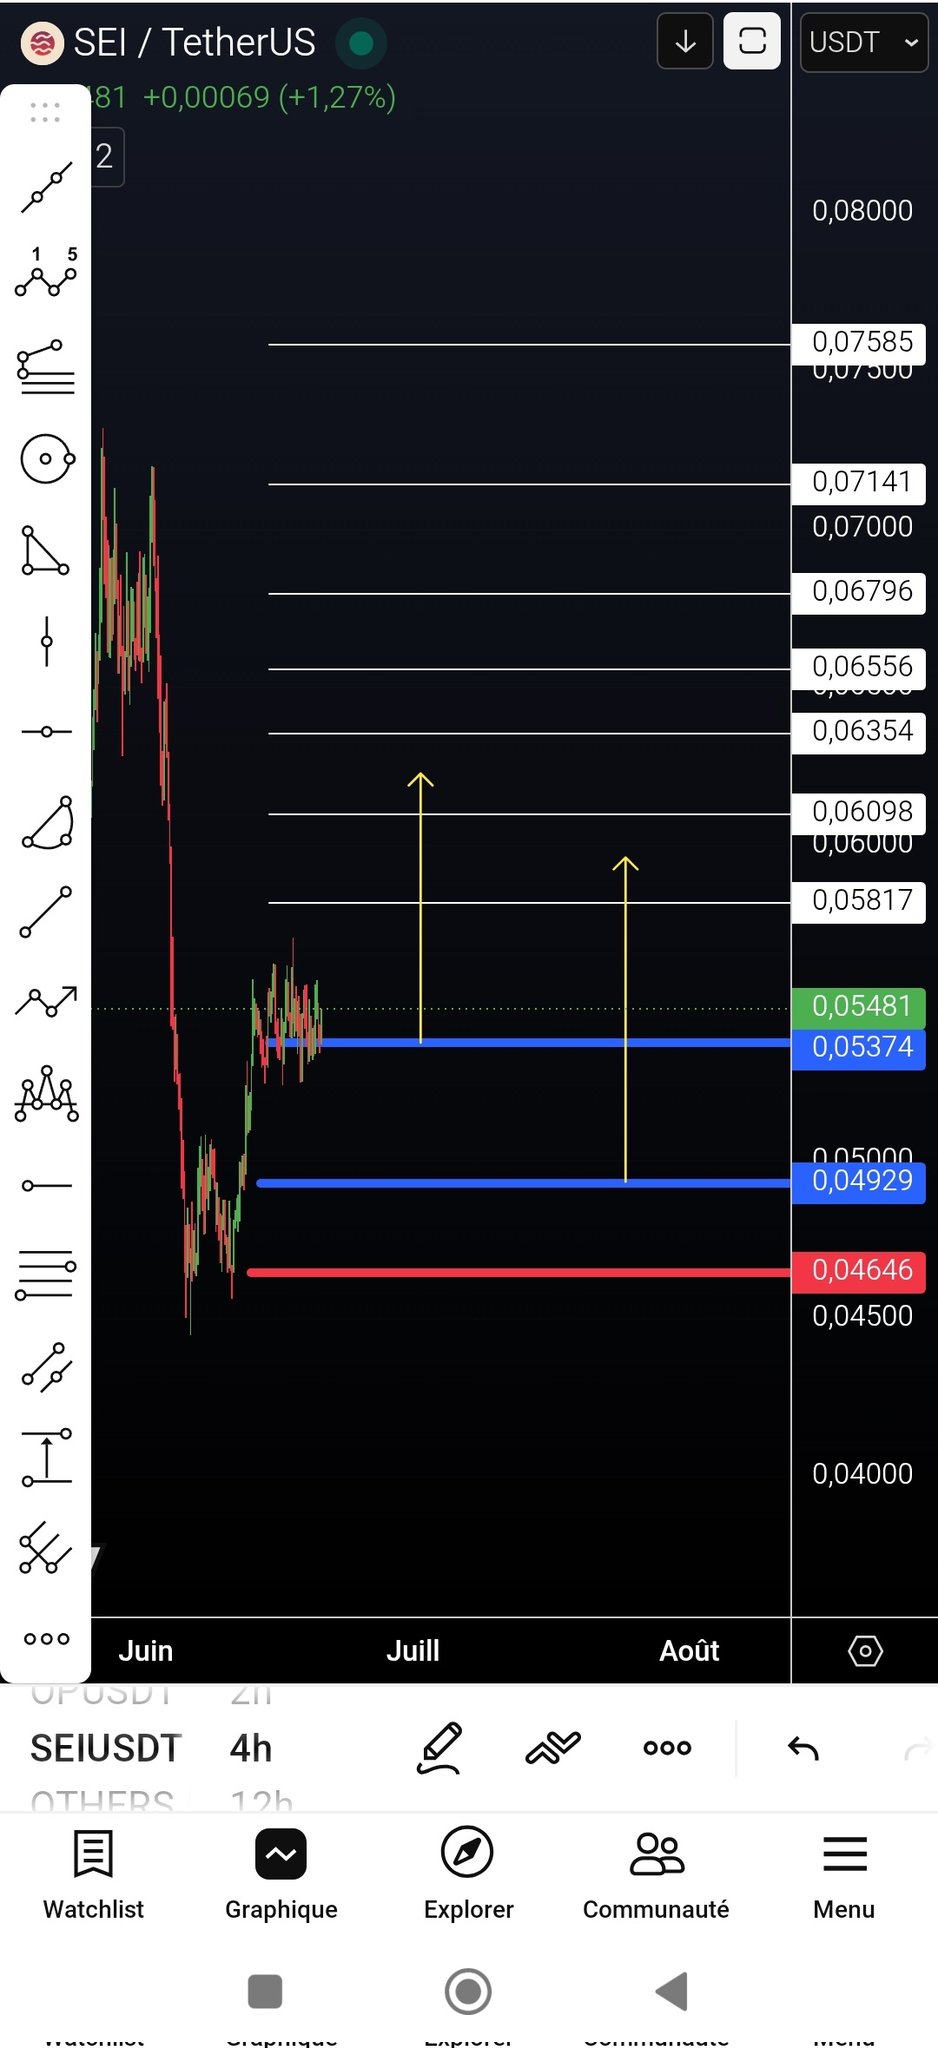
$SEI at $0.05
$INJ at $5
$SUI just under $1
$ONDO with 3X to $1
$TAO holding $200
And most people are still treating it like the cycle is dead.
The TOTAL3 weekly chart, which tracks altcoins excluding Bitcoin and Ethereum, is showing something very similar to the 2022 bottom structure.
Not in price but in momentum.
Back in 2022, altcoins kept bleeding while weekly RSI quietly made a higher low after the FTX saga was over.
Price looked weak and was destroyed.
Everyone assumed another collapse is coming.
But the momentum was already shifting underneath the surface.
That higher low on weekly RSI marked the start of the next major altcoin recovery.
Now look at the current chart.
Altcoin market cap is still down heavily from the 2025 bull top, sitting near the $680B zone, but weekly momentum is again forming a higher low while price refuses to break into a deeper capitulation.
This is exactly the kind of setup that confuses retail.
Because the chart does not look bullish emotionally.
It looks boring, damaged and like nothing is happening.
But that is usually where the reversal structure begins.
→ PRICE IS HOLDING ABOVE THE PANIC ZONE
TOTAL3 has corrected hard, but it has not erased the entire move from the last cycle expansion.
That means the market is weak, but not dead.
→ WEEKLY MOMENTUM IS IMPROVING
The RSI is building a higher low, which tells us sellers are losing strength even while price still looks heavy.
That is how bottoms usually form.
→ THE 2022 FRACTAL IS BACK
The last time altcoins showed this kind of weekly momentum divergence, the market was much closer to the start of an altcoin bull phase than the end of one.
This does not mean altcoins go vertical tomorrow.
But it does mean the bearish momentum may already be fading.
The crowd is waiting for confirmation.
And the chart is already showing accumulation.
 127
127
 18
18
 7.2K
7.2K
2026-06-21 07:27
Trend of SEI after release
Extremely Bullish
Altcoin market is in a dangerously bullish setup, with weekly momentum RSI forming higher lows, indicating a major recovery.
Our Crypto Talk
Media
OnChain_Analyst
C
79.7K @ourcryptotalk Extremely Bullish
Altcoin market is showing a dangerously bullish pattern, weekly momentum is making higher lows, indicating a reversal similar to 2022.
ALTCOINS IN A DANGEROUSLY BULLISH SETUP.
Just like it was after FTX Crash 👀
This gets even better when we see some bottomed charts like :
$SEI at $0.05
$INJ at $5
$SUI just under $1
$ONDO with 3X to $1
$TAO holding $200
And most people are still treating it like the cycle is dead.
The TOTAL3 weekly chart, which tracks altcoins excluding Bitcoin and Ethereum, is showing something very similar to the 2022 bottom structure.
Not in price but in momentum.
Back in 2022, altcoins kept bleeding while weekly RSI quietly made a higher low after the FTX saga was over.
Price looked weak and was destroyed.
Everyone assumed another collapse is coming.
But the momentum was already shifting underneath the surface.
That higher low on weekly RSI marked the start of the next major altcoin recovery.
Now look at the current chart.
Altcoin market cap is still down heavily from the 2025 bull top, sitting near the $680B zone, but weekly momentum is again forming a higher low while price refuses to break into a deeper capitulation.
This is exactly the kind of setup that confuses retail.
Because the chart does not look bullish emotionally.
It looks boring, damaged and like nothing is happening.
But that is usually where the reversal structure begins.
→ PRICE IS HOLDING ABOVE THE PANIC ZONE
TOTAL3 has corrected hard, but it has not erased the entire move from the last cycle expansion.
That means the market is weak, but not dead.
→ WEEKLY MOMENTUM IS IMPROVING
The RSI is building a higher low, which tells us sellers are losing strength even while price still looks heavy.
That is how bottoms usually form.
→ THE 2022 FRACTAL IS BACK
The last time altcoins showed this kind of weekly momentum divergence, the market was much closer to the start of an altcoin bull phase than the end of one.
This does not mean altcoins go vertical tomorrow.
But it does mean the bearish momentum may already be fading.
The crowd is waiting for confirmation.
And the chart is already showing accumulation.
127
18
7.2K
2026-06-21 07:27
Trend of SEI after release
Extremely Bullish
Altcoin market is showing a dangerously bullish pattern, weekly momentum is making higher lows, indicating a reversal similar to 2022.

🇲🇦 CRYPTO🇲🇦BLACK🇲🇦TIGER🇲🇦
TA_Analyst
Trader
C
22.2K @CHARTBTC1 Bullish
If SEI can hold its support level, a rebound is possible, but the target is conservative; the subsequent trend needs to be monitored.
#SEI $SEI
If the token holds this support, it may rebound.
As you can see, I didn't set large targets because there's a lot of talk about this coin.
Set a slightly distant stop with a three‑day close.
If it rebounds, we'll update the token's status to see whether it has moved significantly into positive territory.
Good luck to everyone ♥️ https://t.co/R5CDeT4xxi

abdellatif EL Aissaoui🇲🇦🇲🇦 D
89 @abdella44393170 @CHARTBTC1 Sei
14
3
1.8K
2026-06-20 22:57
Trend of SEI after release
Bullish
If SEI can hold its support level, a rebound is possible, but the target is conservative; the subsequent trend needs to be monitored.
Price Prediction
When is a good time to buy SEI? Should I buy or sell SEI now?
When deciding whether it’s a good time to buy or sell Sei (SEI), it’s important to first align with your own trading strategy and risk profile.Long-term investors and short-term traders often interpret market conditions differently, so your decision should reflect your personal approach. According to the latest SEI 4-hour technical analysis, the current trading signal is Hold. According to the latest SEI 1-day technical analysis, the current signal is Hold.

Beacon Prediction
Probabilistic Price Forecast (Next 24 Hours)Beacon Prediction Disclaimer
The data results displayed on this page are analyzed based on actual trading data (OHLCV) of the selected trading pair along with corresponding technical indicators.
This prediction is an experimental technical product and is provided for reference purposes only. It does not constitute investment advice. Unexpected real-world events may significantly impact market behavior. Traders should make decisions with caution.
This prediction is an experimental technical product and is provided for reference purposes only. It does not constitute investment advice. Unexpected real-world events may significantly impact market behavior. Traders should make decisions with caution.
About Sei
Sei (SEI) is a cryptocurrency launched in 2023. Sei has a current supply of 10,000,000,000 with 7,217,777,777 in circulation. The last known price of Sei is 0.05500533 USD and is up 2.80 over the last 24 hours. It is currently trading on 369 active market(s) with $31,761,944.23 traded over the last 24 hours. More information can be found at https://www.sei.io/.
Read More


Buy SEI
Trade SEI