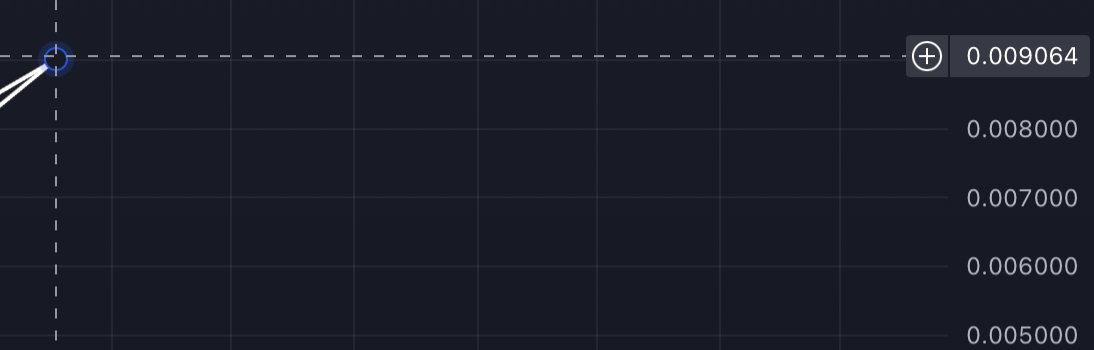
$PUMP update: Huge bullish divergence on the daily. I think during the next market rally this one could make some noise. Targets are 0019 and 0029 and then there is a cycle target meeting a double top at 009 almost 1 cent. https://t.co/ZEUWnTDBDV


 3.2K @KubrickShining
 $PUMP update: Huge bullish divergence on the daily. I think during the next market rally this one could make some noise. Targets are 0019 and 0029 and then there is a cycle target meeting a double top at 009 almost 1 cent. https://t.co/ZEUWnTDBDV
 0
0
 0
0
 59
59
 9.3K @EtherRawl
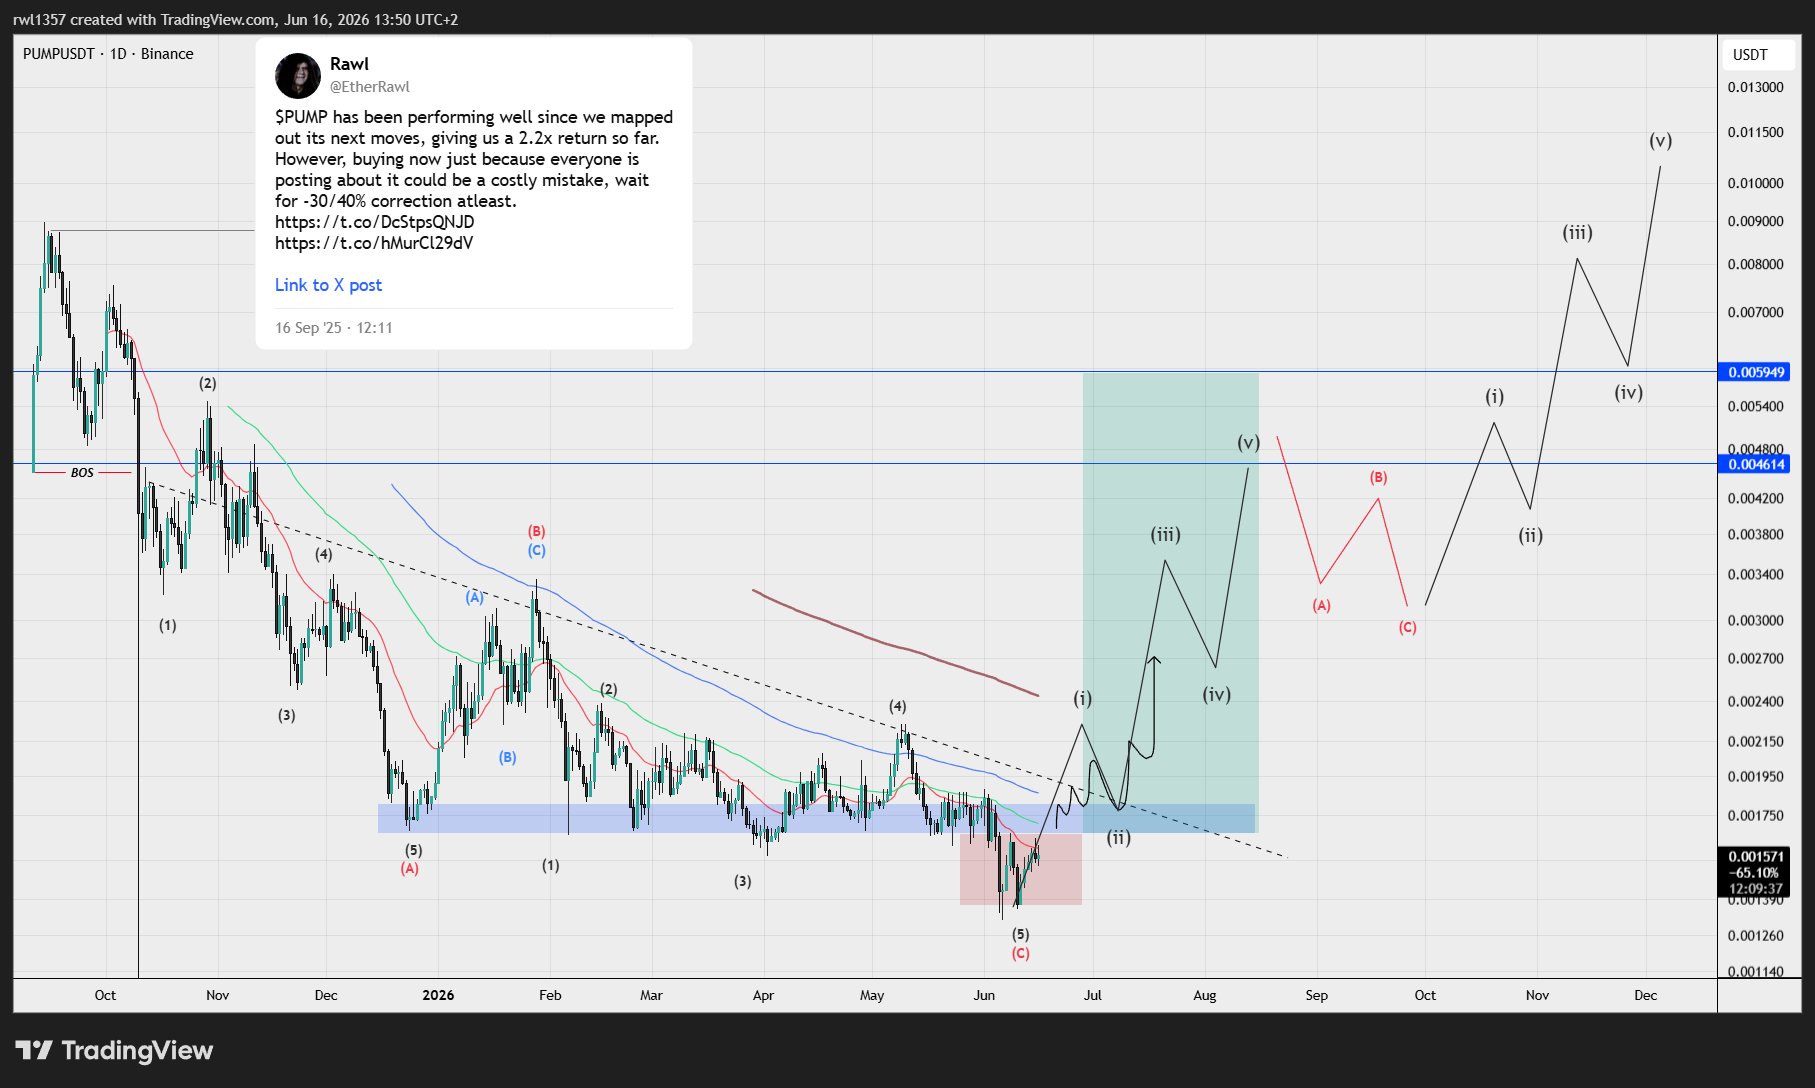
 Lots of altcoins are starting to look attractive from a technical analysis point of view, especially those that are holding a higher low above their February low while Bitcoin itself has made a new low. To me, that signals that investors are shifting their approach.
Even on altcoins such as PUMP, which has made new lows, the bearish structure is showing signs of exhaustion. This can turn into a deviation after sweeping the liquidity below all those lows, resulting in a bullish EW count, breaking the bearish trendline, and triggering a short squeeze that sweeps liquidity above all those highs where the trend began around 0.0046–0.0060, followed by an intra-range correction before eventually pushing toward a new all time high.
I remember very well how the entire CT was bullish on PUMP even accounts I had never seen before were talking about it. At the time I saw that as a warning sign not to buy into the euphoria because the price would eventually drop again, and right now there's literally nobody talking about it.
P.s the trigger comes only after we reclaim that blue box
 44
2
2.1K
44
2
2.1K
 70.9K @CRYPTOKRALI3
 The chart is usually the last thing I check.
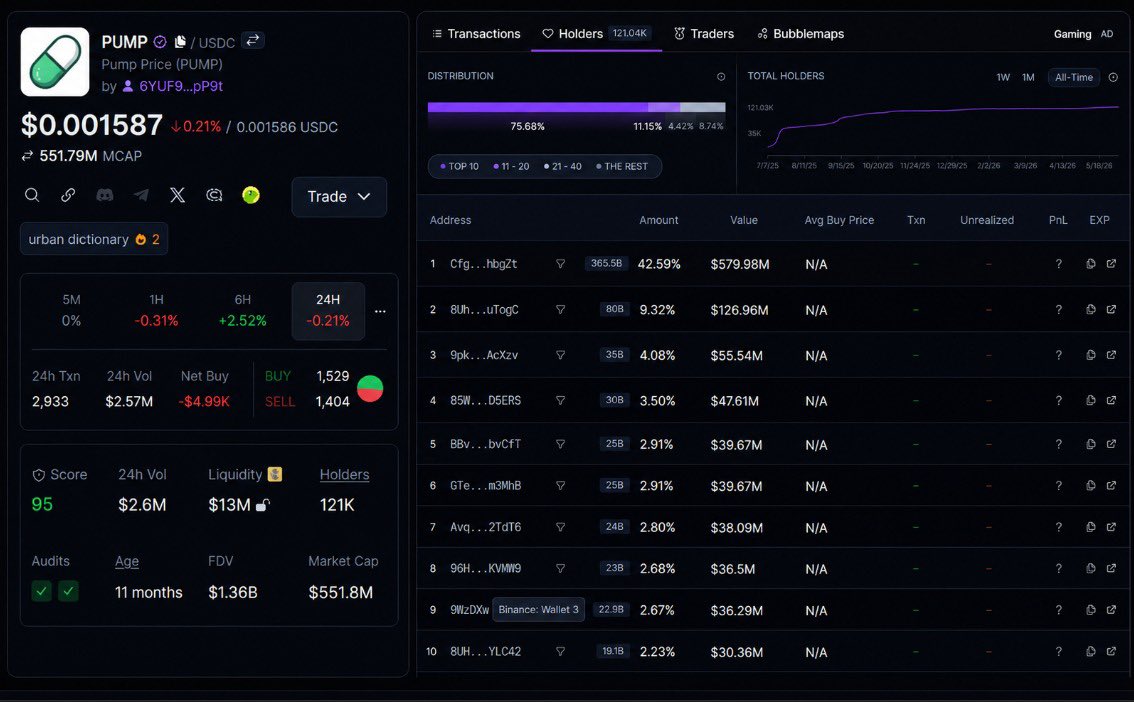
When I open a token on @GeckoTerminal, I go straight to the Holders tab first.
Using $PUMP as an example:
The first thing I look at is concentration. Here, the top 10 wallets hold roughly 75.7% of the supply while the largest wallet alone sits around 42.6%.
That doesn't automatically make it good or bad.
The next step is figuring out who those wallets actually are. Exchange wallets, liquidity-related wallets, and long-term holders tell a very different story than an unlabeled cluster controlling a large share of supply.
Then I check holder growth. In this case, the token has grown to more than 121K holders over time, which helps provide context beyond the distribution numbers alone.
The Holders tab isn't about predicting what happens next. It's about understanding who controls the supply before making any decision.
If you're not checking holders before the chart, you're probably missing half the story.
Check the $PUMP Holders tab on GeckoTerminal and run the same process yourself.
 230
72
12.8K
230
72
12.8K