G’day Folks,
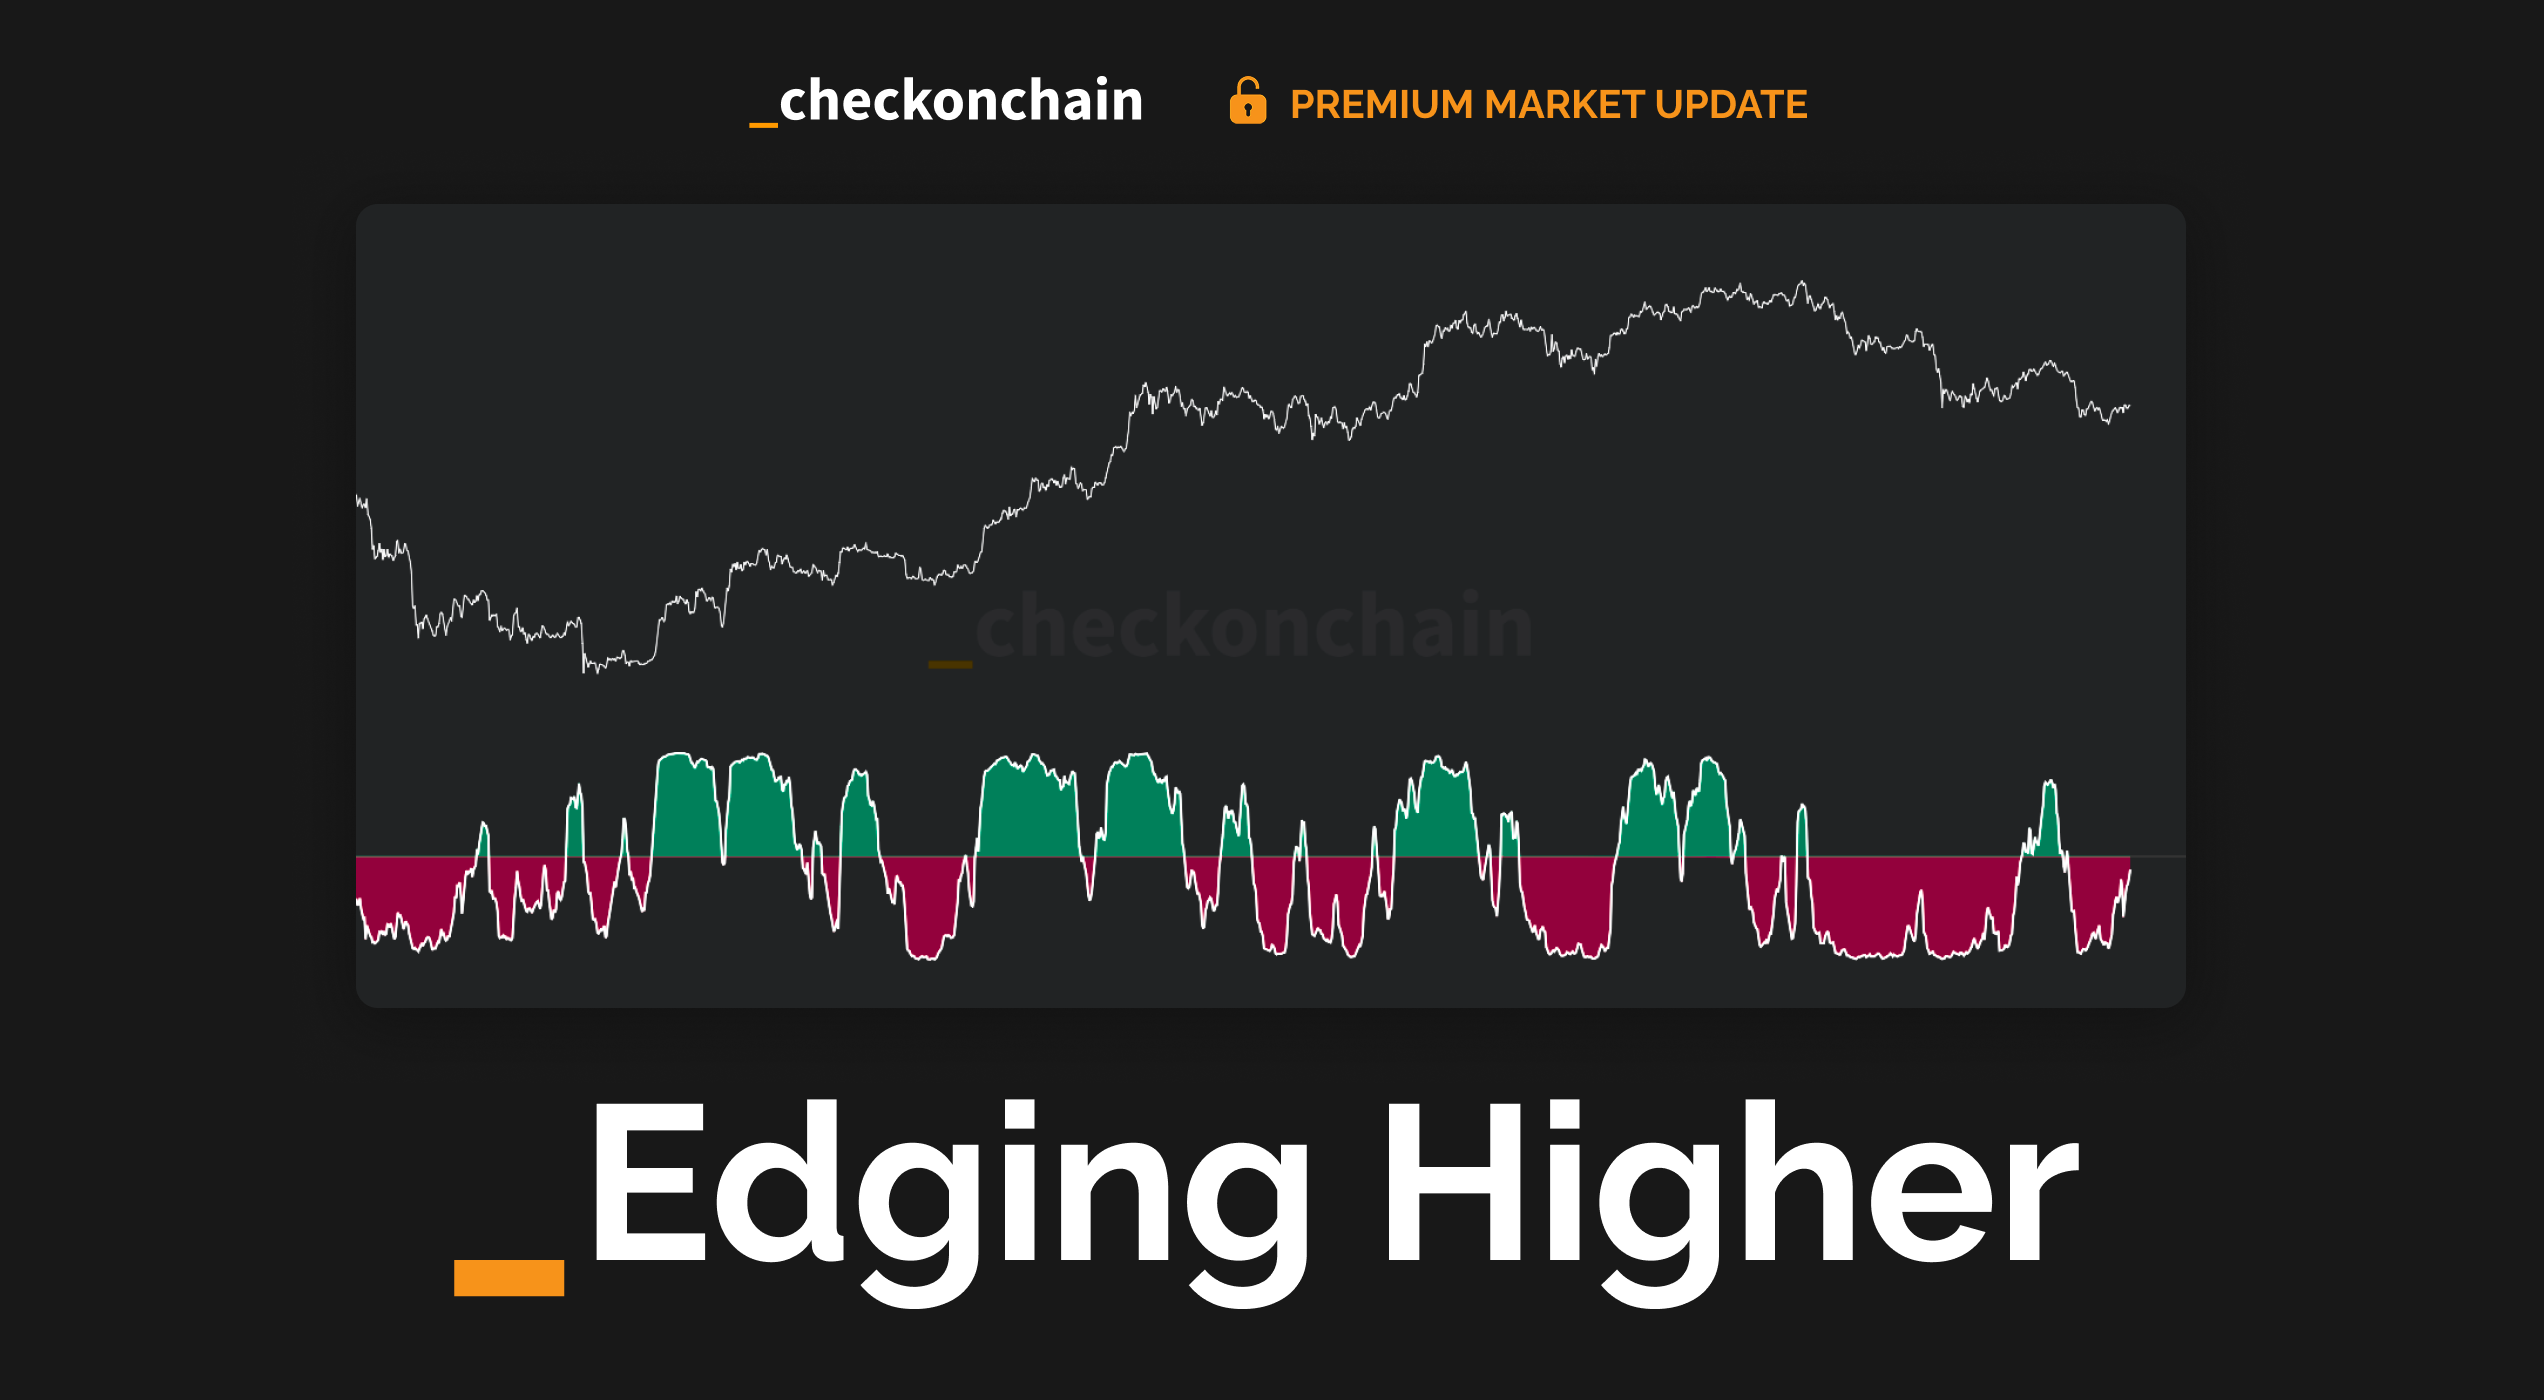
The Bitcoin price has been edging higher in recent weeks, after recovering the 200-week moving average around $63k. The market did experience a weekly close below the 200WMA towards the end of of June, but has since held above it for four consecutive weeks.
Whilst the 200WMA is just a line on a chart, it is one that is widely observed by investors and traders, particularly those with more experience, and longer investing time-horizons.
Why this specific period of moving average became a common ‘deep value’ price model across numerous asset classes is a mystery of history and human behaviour. However, in the world of Bitcoin, we have a somewhat unique lens to visualise and model what investors do around that level.
In today’s post, I will explore how the Bitcoin supply structure has changed since hitting the 200WMA in early June. I’ll also analyse a series of momentum divergences which are well underway in developing under the market hood.
Become a Premium subscriber to access today’s Video Update (37 mins), Written Article and TL;DR Summary.
Disclaimer: The market is risky, and investment needs to be cautious. This article does not constitute investment advice. Users should consider whether any opinions, views, or conclusions in this article are in line with their specific circumstances. Investment based on this is at their own risk.