

📺 Ubisoft shuts Champions Tactics Oct 30 as WEMIX loses $724K to exploit
Learn more about:
Full breakdown 👇
➡️ Watch Video: https://t.co/85N6fwxxcI
Rewards
Futures Daily Draw
100% Chance To Win With Daily Trades
Spot Daily Draw
Win 8,888 USDT In Grand Prizes
Mobile Top-Up
Top up mobiles easily, online, secure
Send
Send money globally, fast and secure
BitMart Mall
Live on crypto
WEMIX Live Price data
Today's price of WEMIX Is $ 0.19 (WEMIX/USD). With A Market Cap Of $ 99.85M USD. 24-Hour Trading Volume Of $ 448.77K USD, A 24-Hour Price Change Of +0.00%, And A Circulating Supply Of 499.36M WEMIX.
WEMIX WEMIX Price History USD
Track the price of WEMIX for today, 7 days, 30 days and 90 days
Period
Change
Change (%)
Today
$ 0
0.00%
7days
--
--
30days
--
--
90days
--
--
Own WEMIX Now
Buy and sell WEMIX easily and securely on BitMart.
WEMIX Market Information
$ 0.19 24h Range $ 0.19
All time high
$ 0
All time low
$ 0
24h Change
0.00%
24h Vol
$ 448,774.22
Circulating supply
499.36M
WEMIX
Market cap
$ 99.85M
Max supply
0.59B
WEMIX
Fully diluted market cap
$ 117.97M
Trade WEMIX
WEMIX X Insight

PlayToEarn
Media
Researcher
D
 83.0K @PlayToEarn
 Extremely Bearish
WEMIX因漏洞损失724K美元,短期看空
 24
24
 7
7
 8.6K
8.6K
2026-07-31 12:57
Trend of WEMIX after release
Bearish
WEMIX因漏洞损失724K美元,短期看空

Kurnia Bijaksana
Trader
Educator
C
46.9K @mkbijaksana Extremely Bullish
The tweet shares an altcoin trading strategy that identifies and follows rising trends when BTC dominance is falling and altcoins are bullish.
Pro tip: If the market is in a condition where
- BTC dominance is falling
- TOTAL2 shows a bullish signal
- Large altcoins are above the 21 EMA on the 1-day timeframe
Check the method below
Kurnia Bijaksana
Trader
Educator
C
46.9K @mkbijaksana DAILY CRYPTO TRADING TUTORIAL: FOLLOW THE TREND (BULLISH)
This method utilizes the follow‑the‑trend principle.
My principle: What goes up will keep going up until a reversal sign appears.
Therefore, we take advantage of assets that are gaining momentum and try to follow their upward move.
Step 1: Market Screening.
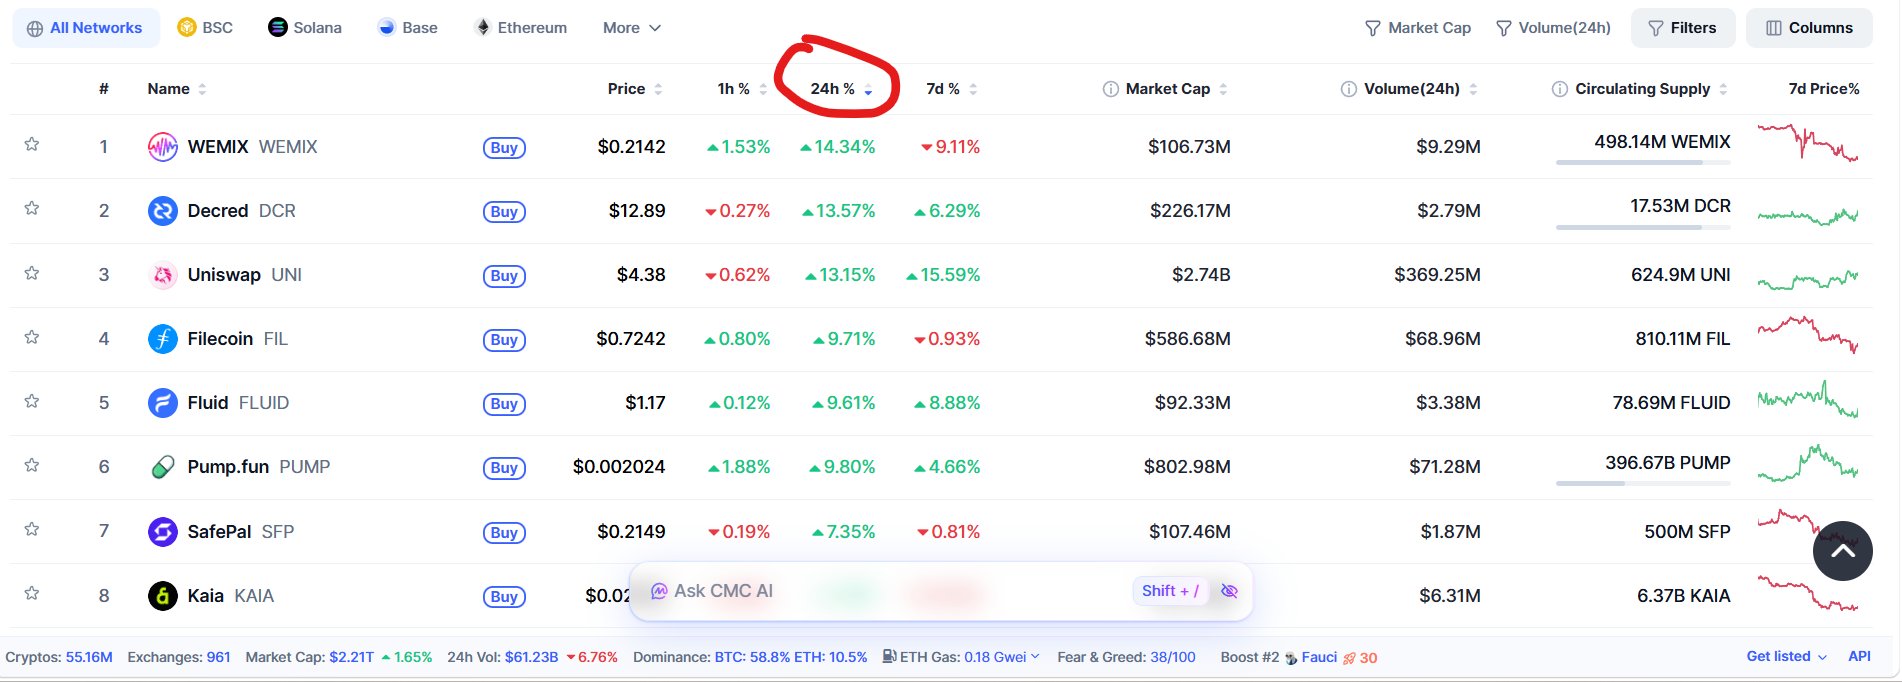
Go to CoinMarketCap, or your favorite exchange. Sort by 24H% or top gainers. You can click the 24H% or %Gains column depending on the exchange, until it lists the highest (see image 1). The example image shows WEMIX, DCR, UNI, among others.
Step 2: Ensure a bullish bias.
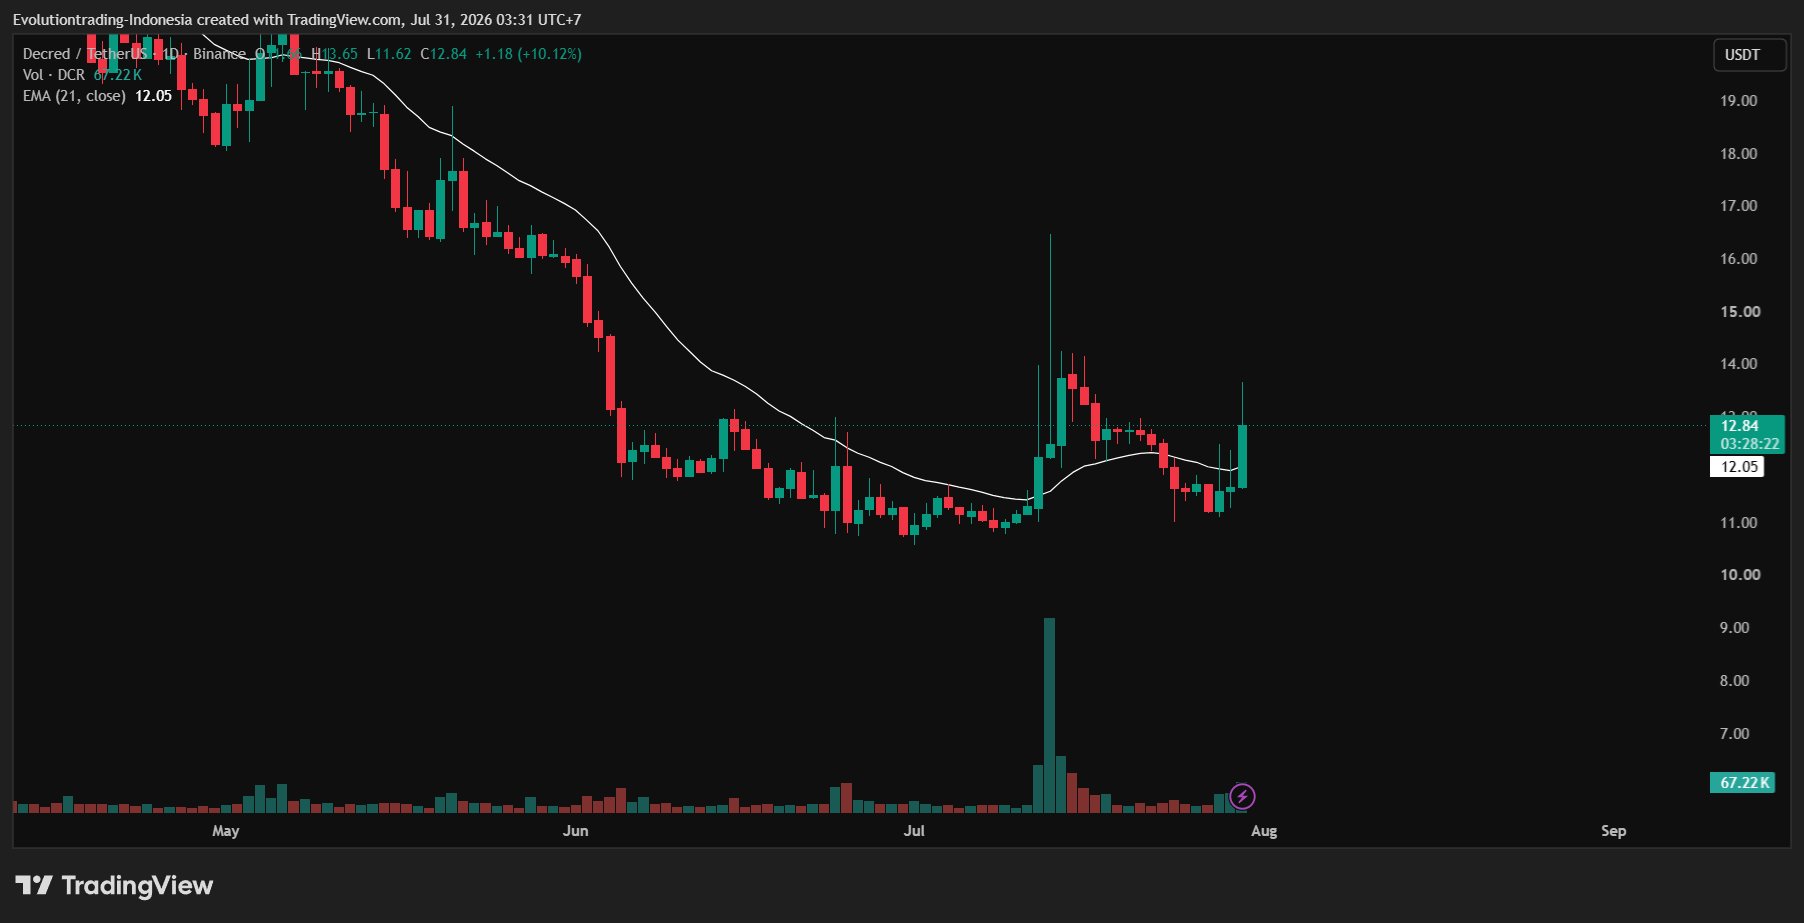
Open TradingView (or the exchange you use, on its chart). Switch to the 1‑day timeframe first. Make sure:
- The chart is bullish (green) and
- Not too high. Avoid charts that look like tall pillars on the 1‑day timeframe; they are usually too late.
(See example in image 2)
You can look at several charts, mark those meeting the criteria, then proceed to step 3.
Step 3: Entry Trigger
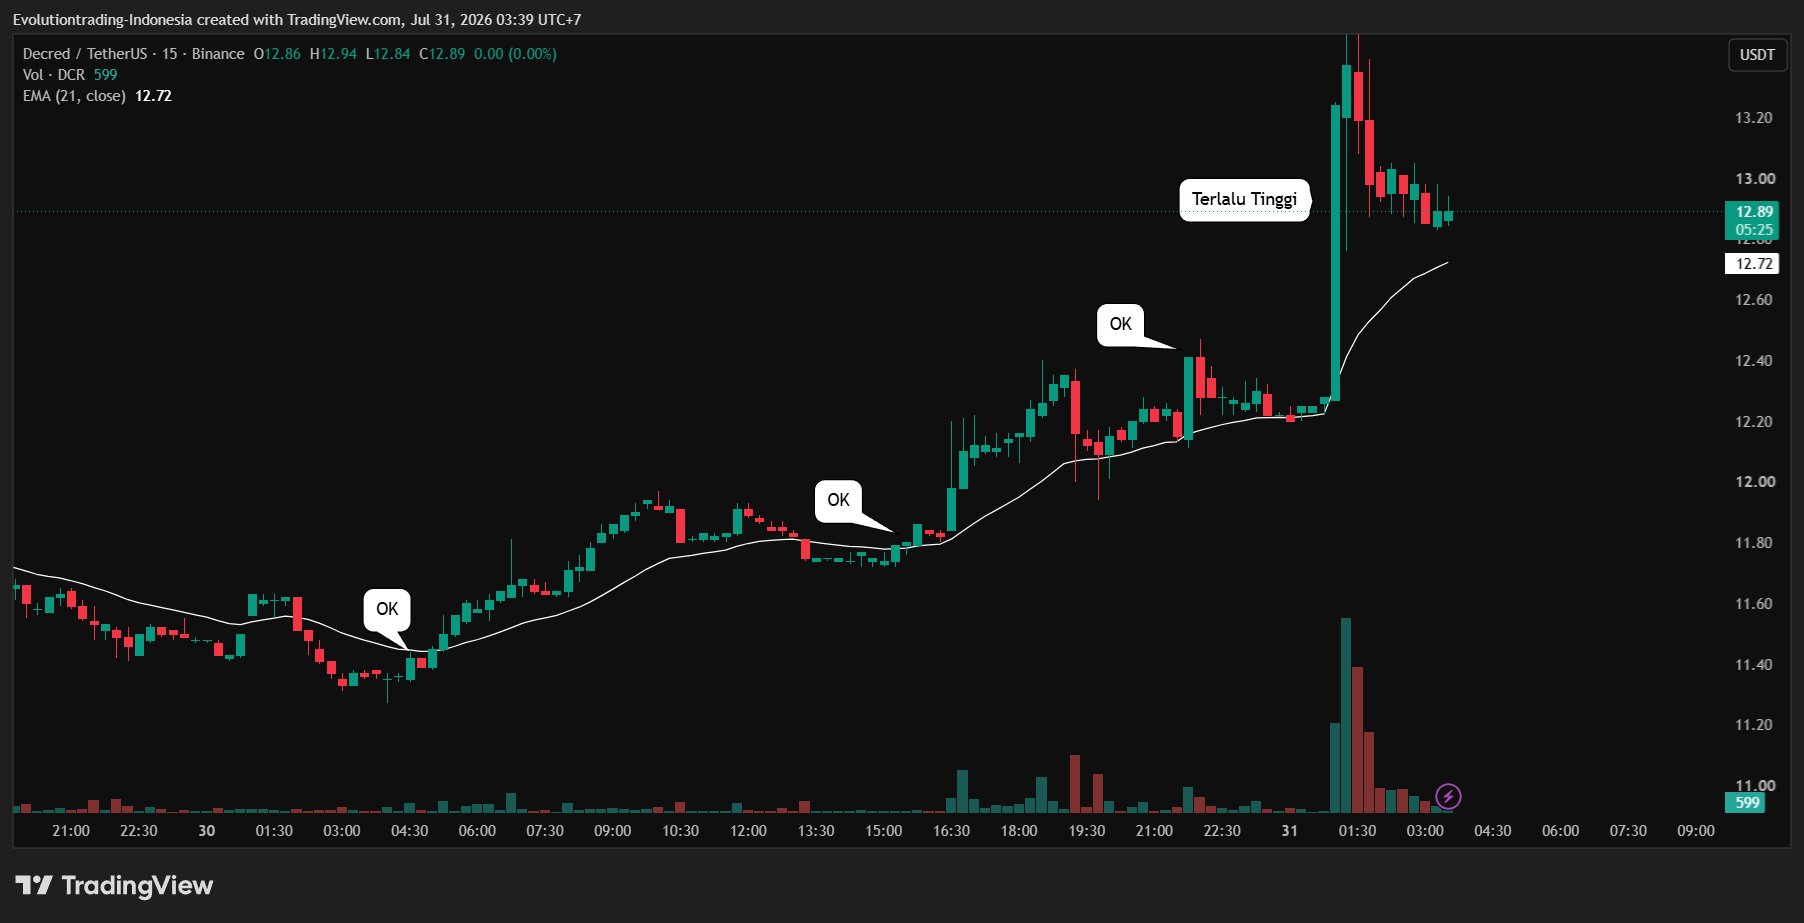
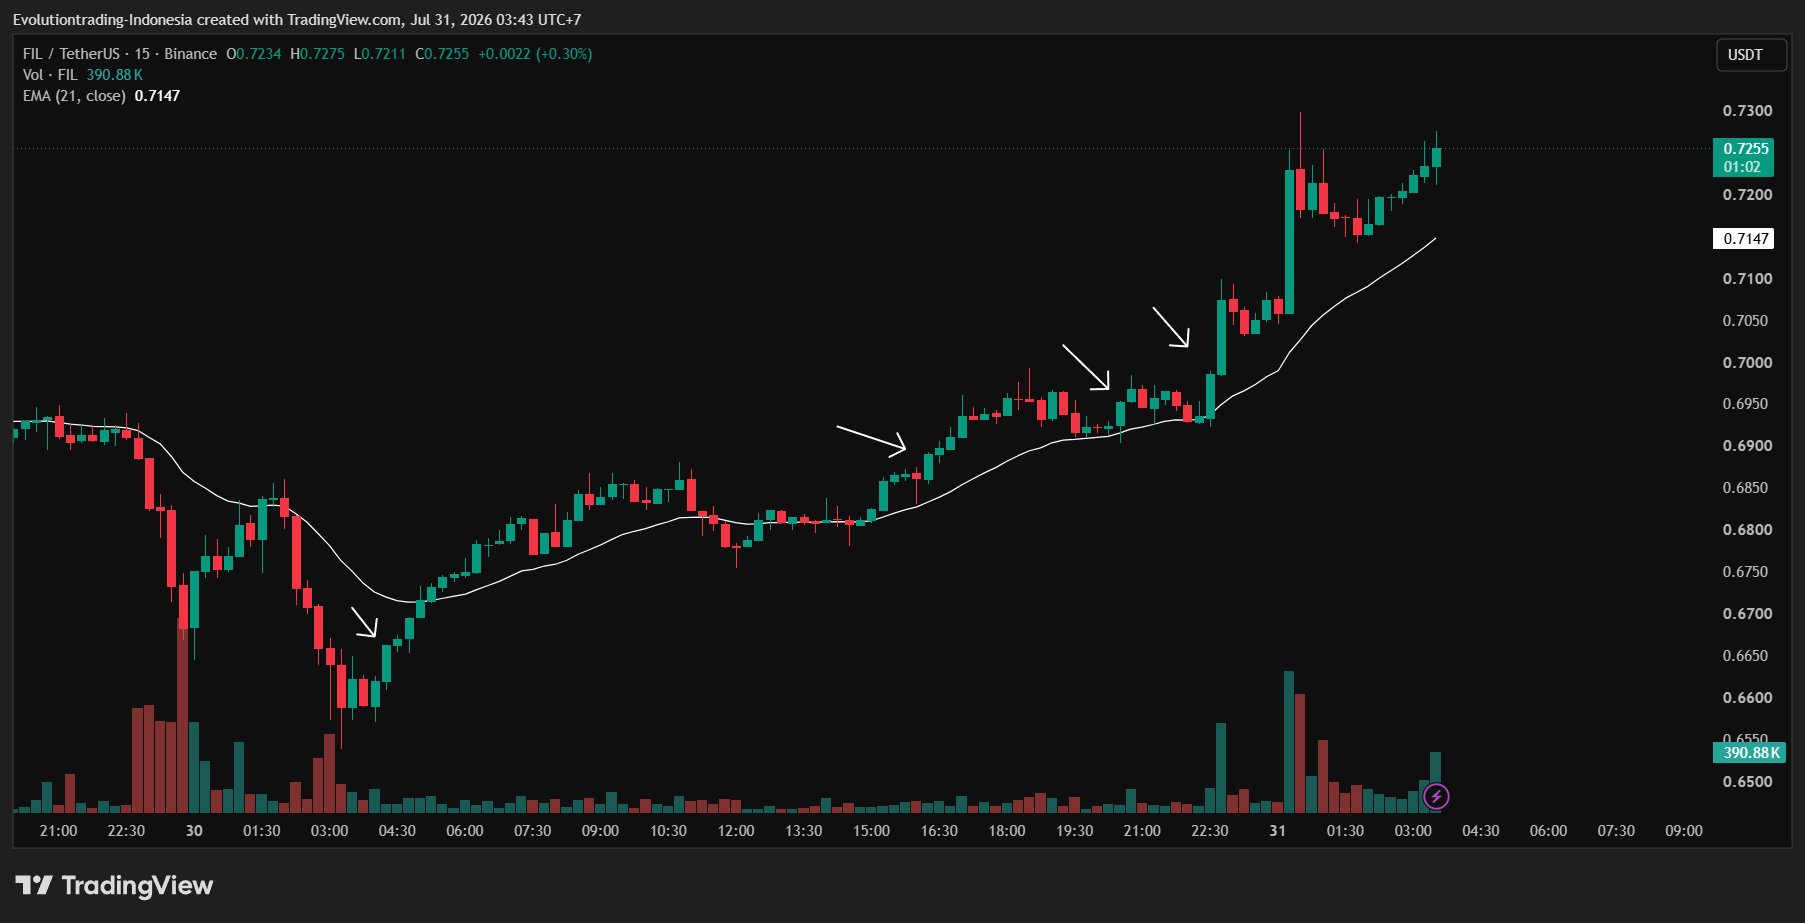
There are many ways, I will discuss them later.
 21
0
2.3K
21
0
2.3K
2026-07-31 04:57
Trend of WEMIX after release
Extremely Bullish
The tweet shares an altcoin trading strategy that identifies and follows rising trends when BTC dominance is falling and altcoins are bullish.
Kurnia Bijaksana
Trader
Educator
C
46.9K @mkbijaksana Bullish
The tweet shares an altcoin trading strategy that identifies and follows rising trends when BTC dominance is falling and altcoins are bullish.
DAILY CRYPTO TRADING TUTORIAL: FOLLOW THE TREND (BULLISH)
This method utilizes the follow‑the‑trend principle.
My principle: What goes up will keep going up until a reversal sign appears.
Therefore, we take advantage of assets that are gaining momentum and try to follow their upward move.
Step 1: Market Screening.
Go to CoinMarketCap, or your favorite exchange. Sort by 24H% or top gainers. You can click the 24H% or %Gains column depending on the exchange, until it lists the highest (see image 1). The example image shows WEMIX, DCR, UNI, among others.
Step 2: Ensure a bullish bias.
Open TradingView (or the exchange you use, on its chart). Switch to the 1‑day timeframe first. Make sure:
- The chart is bullish (green) and
- Not too high. Avoid charts that look like tall pillars on the 1‑day timeframe; they are usually too late.
(See example in image 2)
You can look at several charts, mark those meeting the criteria, then proceed to step 3.
Step 3: Entry Trigger
There are many ways, I will discuss them later.
190
6
32.6K
2026-07-31 03:17
Trend of WEMIX after release
Bullish
The tweet shares an altcoin trading strategy that identifies and follows rising trends when BTC dominance is falling and altcoins are bullish.
Price Prediction
When is a good time to buy WEMIX? Should I buy or sell WEMIX now?
When deciding whether it’s a good time to buy or sell WEMIX (WEMIX), it’s important to first align with your own trading strategy and risk profile.Long-term investors and short-term traders often interpret market conditions differently, so your decision should reflect your personal approach. According to the latest WEMIX 4-hour technical analysis, the current trading signal is Hold.

Beacon Prediction
Probabilistic Price Forecast (Next 24 Hours)Beacon Prediction Disclaimer
The data results displayed on this page are analyzed based on actual trading data (OHLCV) of the selected trading pair along with corresponding technical indicators.
This prediction is an experimental technical product and is provided for reference purposes only. It does not constitute investment advice. Unexpected real-world events may significantly impact market behavior. Traders should make decisions with caution.
This prediction is an experimental technical product and is provided for reference purposes only. It does not constitute investment advice. Unexpected real-world events may significantly impact market behavior. Traders should make decisions with caution.
About WEMIX
WEMIX (WEMIX) is a cryptocurrency launched in 2020. WEMIX has a current supply of 560,158,782.4927065 with 499,361,870.28307045 in circulation. The last known price of WEMIX is 0.19399076 USD and is up 1.22 over the last 24 hours. It is currently trading on 65 active market(s) with $346,636.25 traded over the last 24 hours. More information can be found at http://wemix.com/.
Read More
Official Links
Chain Explorer
Buy WEMIX
Trade WEMIX