FET (FET)

$0.1398  -0.85%  24H

Índice de sentimiento social (ISS)

Clasificación del pulso del mercado (CPM)

Publicaciones de X

  • logical TA_Analyst Trader A
     1.38K  @0xLogicalx

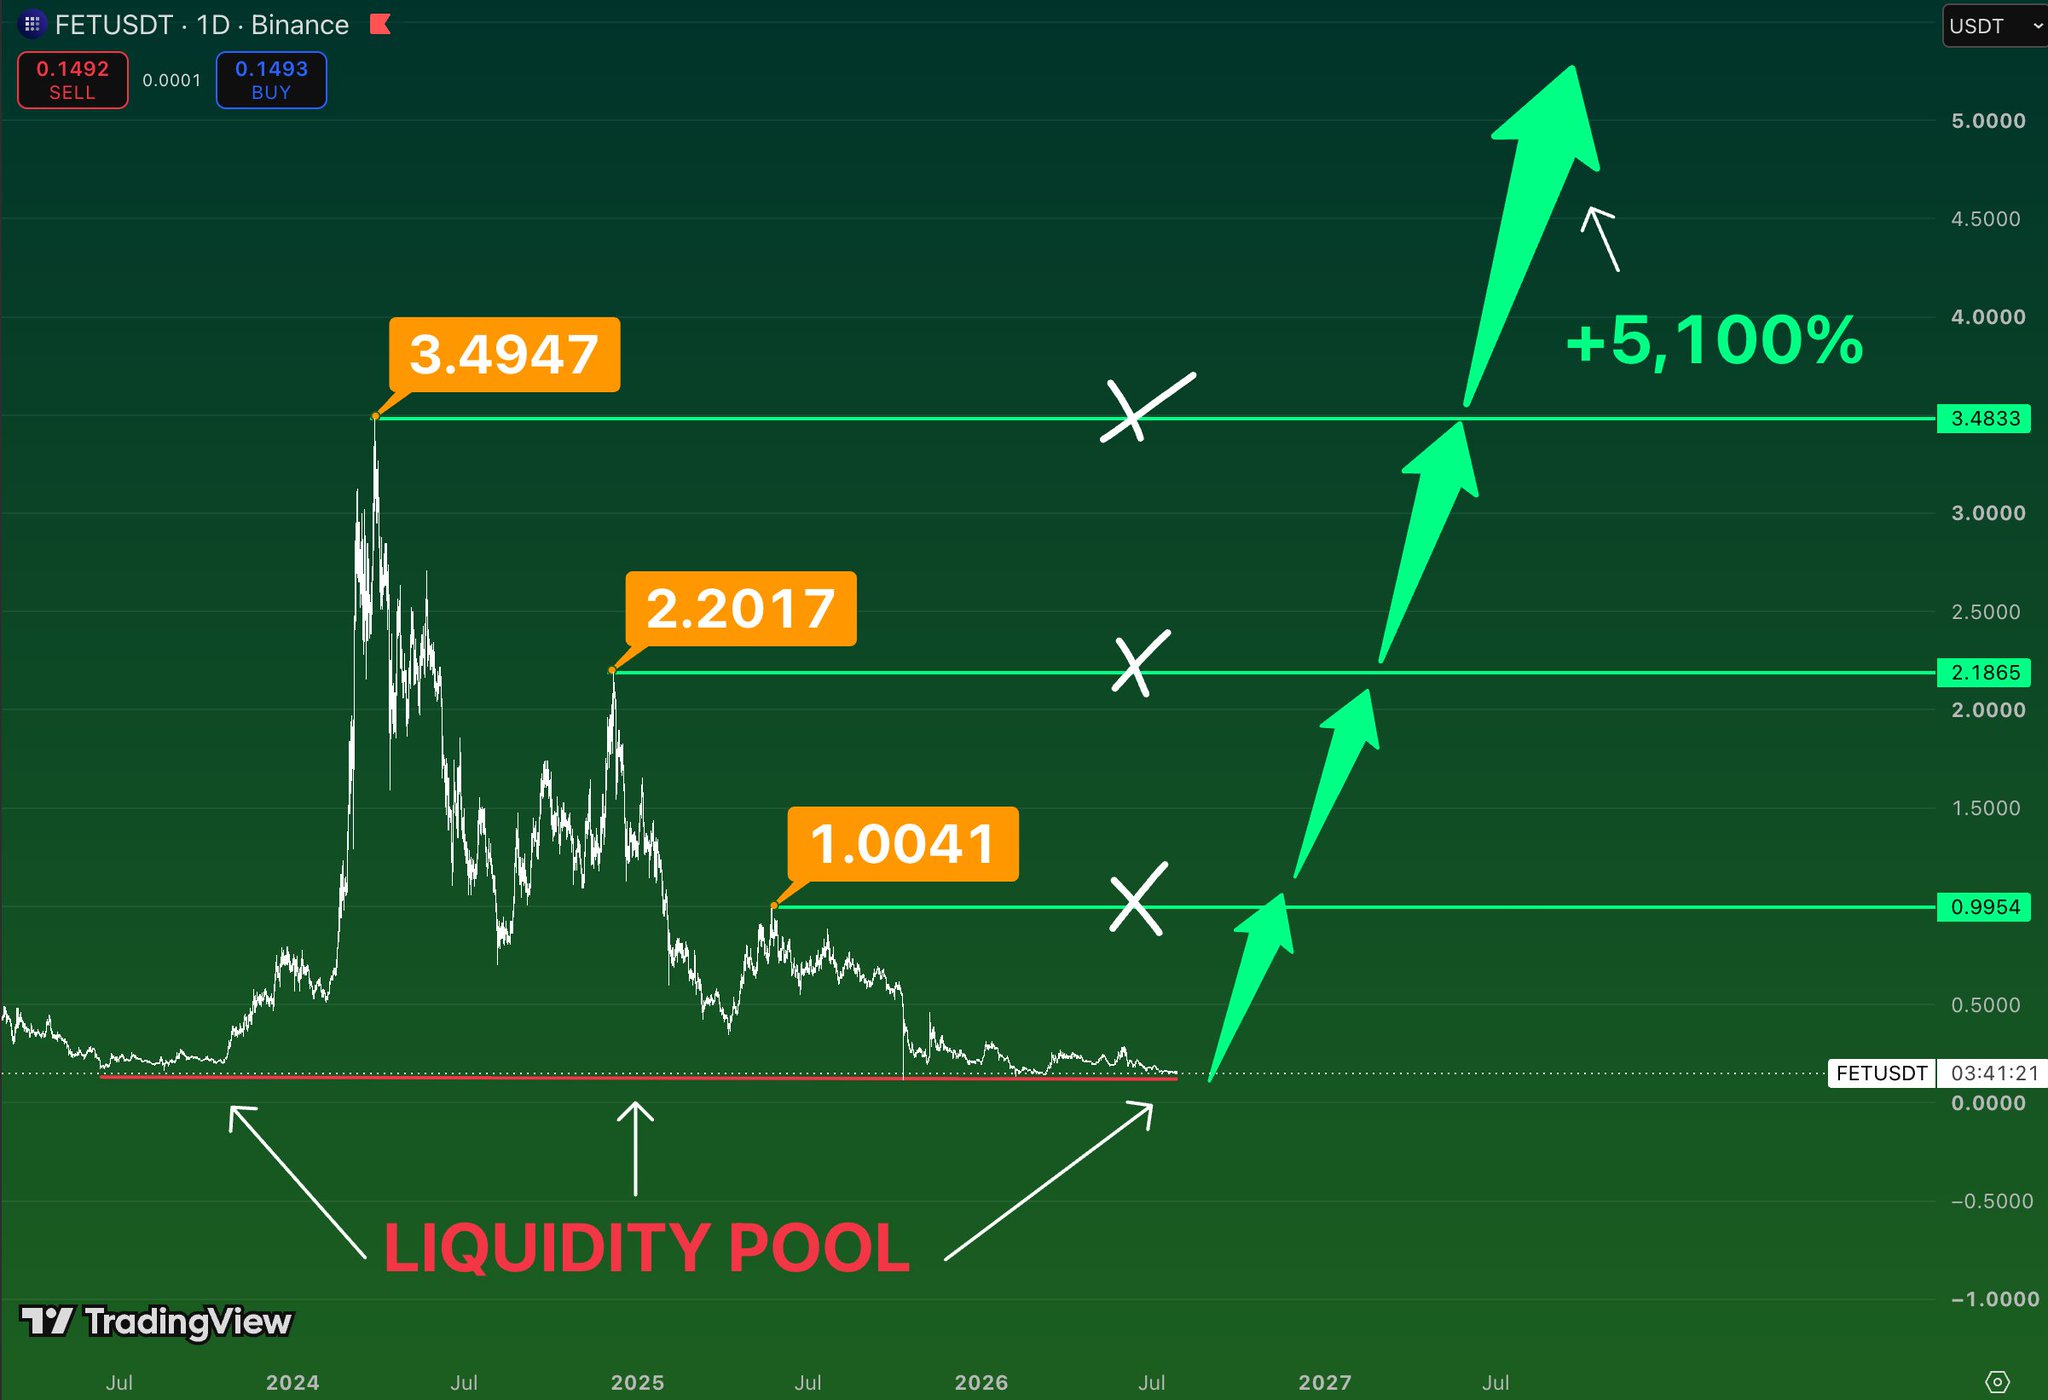
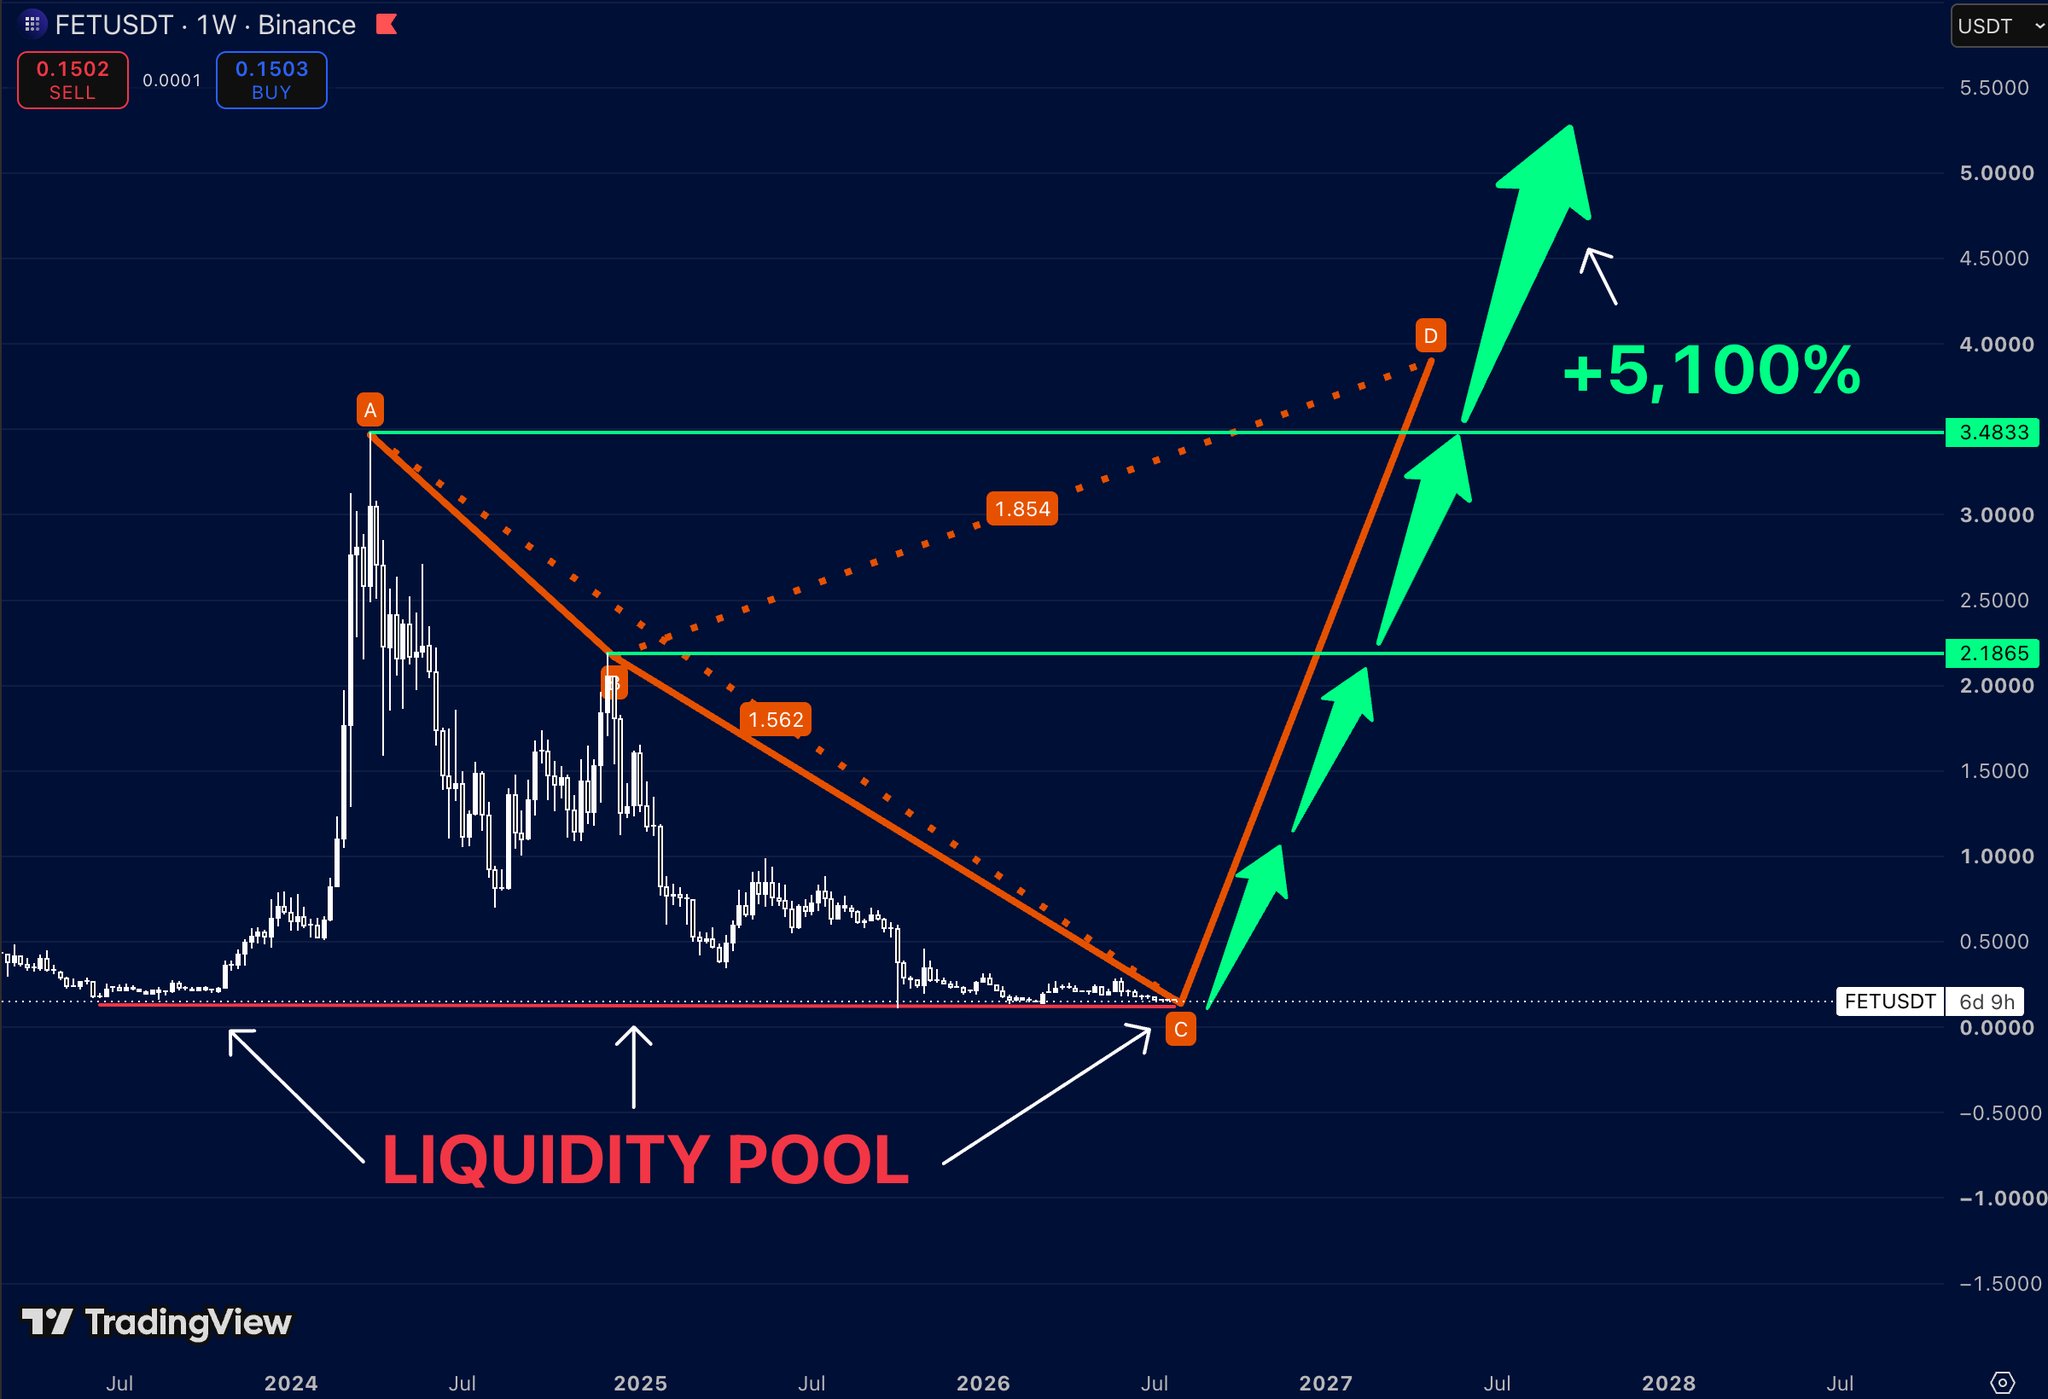
    $FET is holding a major liquidity pool after a prolonged correction. With sellers exhausted and buyers defending long-term support the chart is setting up for a potential multi-stage recovery. The first objective sits near $1.00. Reclaiming that level would be the first signal that long-term momentum is turning back in favor of buyers. Above it, the next major resistance comes in around $2.19. Breaking that zone would confirm a broader trend reversal and open the door for a much stronger expansion. The final macro target stands at $3.48. A move back into that resistance would represent a gain of more than 5,000% from current prices and complete a full recovery toward the previous cycle highs.

     1  0  167
    Leer original >
    Tendencia de FET tras el lanzamiento
     Extremadamente alcista
    FET shows strong recovery potential after a long-term correction, with a target price up to $3.48, representing a gain of over 5,000%.
  • @TakeProfitNow D
     1.15K  @TakePr0fitN0w

    $FET has completed a multi-year correction back into a major liquidity zone. If this base holds, the chart points toward one of the strongest recovery setups among large-cap AI tokens. For nearly three years, sellers controlled every rally. Now price is sitting on the same liquidity area where long-term demand has repeatedly stepped in. The first major objective is $2.19. Reclaiming that level would confirm that the long-term trend has shifted back in favor of buyers. Above it, the next resistance sits around $3.48. Breaking that zone would put the previous cycle highs back within reach and likely attract a fresh wave of momentum. From current levels, the full move projects more than 5,000% upside. If the AI narrative returns in full force, $FET is one of the charts that could surprise the market.

     57  5  2.16K
    Leer original >
    Tendencia de FET tras el lanzamiento
     Extremadamente alcista
    FET has completed a multi-year correction and is in a liquidity zone, with the technical chart showing over 5,000% upside potential.
  • CW OnChain_Analyst Trader B
     22.77K  @CW8900

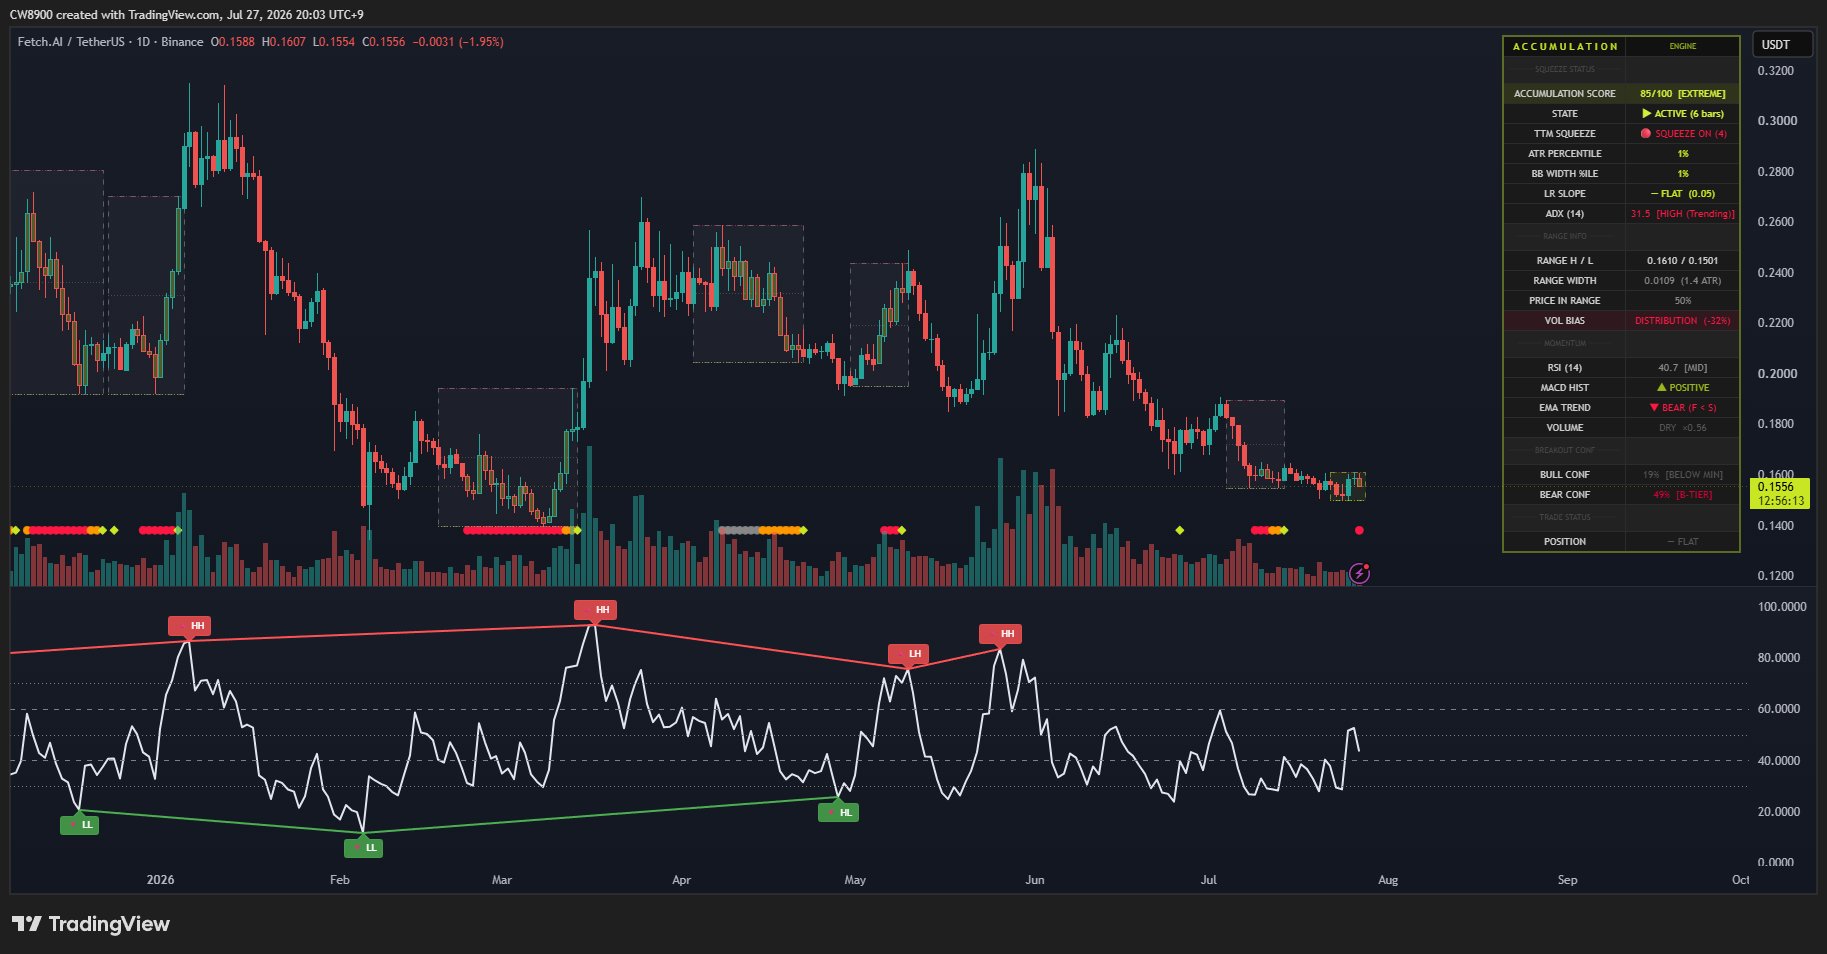
    The accumulation of $FET has continued for 6 days. The accumulation score is 85. The accumulation range is $0.15-$0.161. https://t.co/SHjl04uXCw

     81  7  3.85K
    Leer original >
    Tendencia de FET tras el lanzamiento
     Extremadamente alcista
    FET has been in an extreme accumulation state for 6 consecutive days, with an accumulation score of 85 and an accumulation range of $0.15-$0.161.
  • AYMAN TA_Analyst Trader S
     3.75K  @Crypto_Ayman

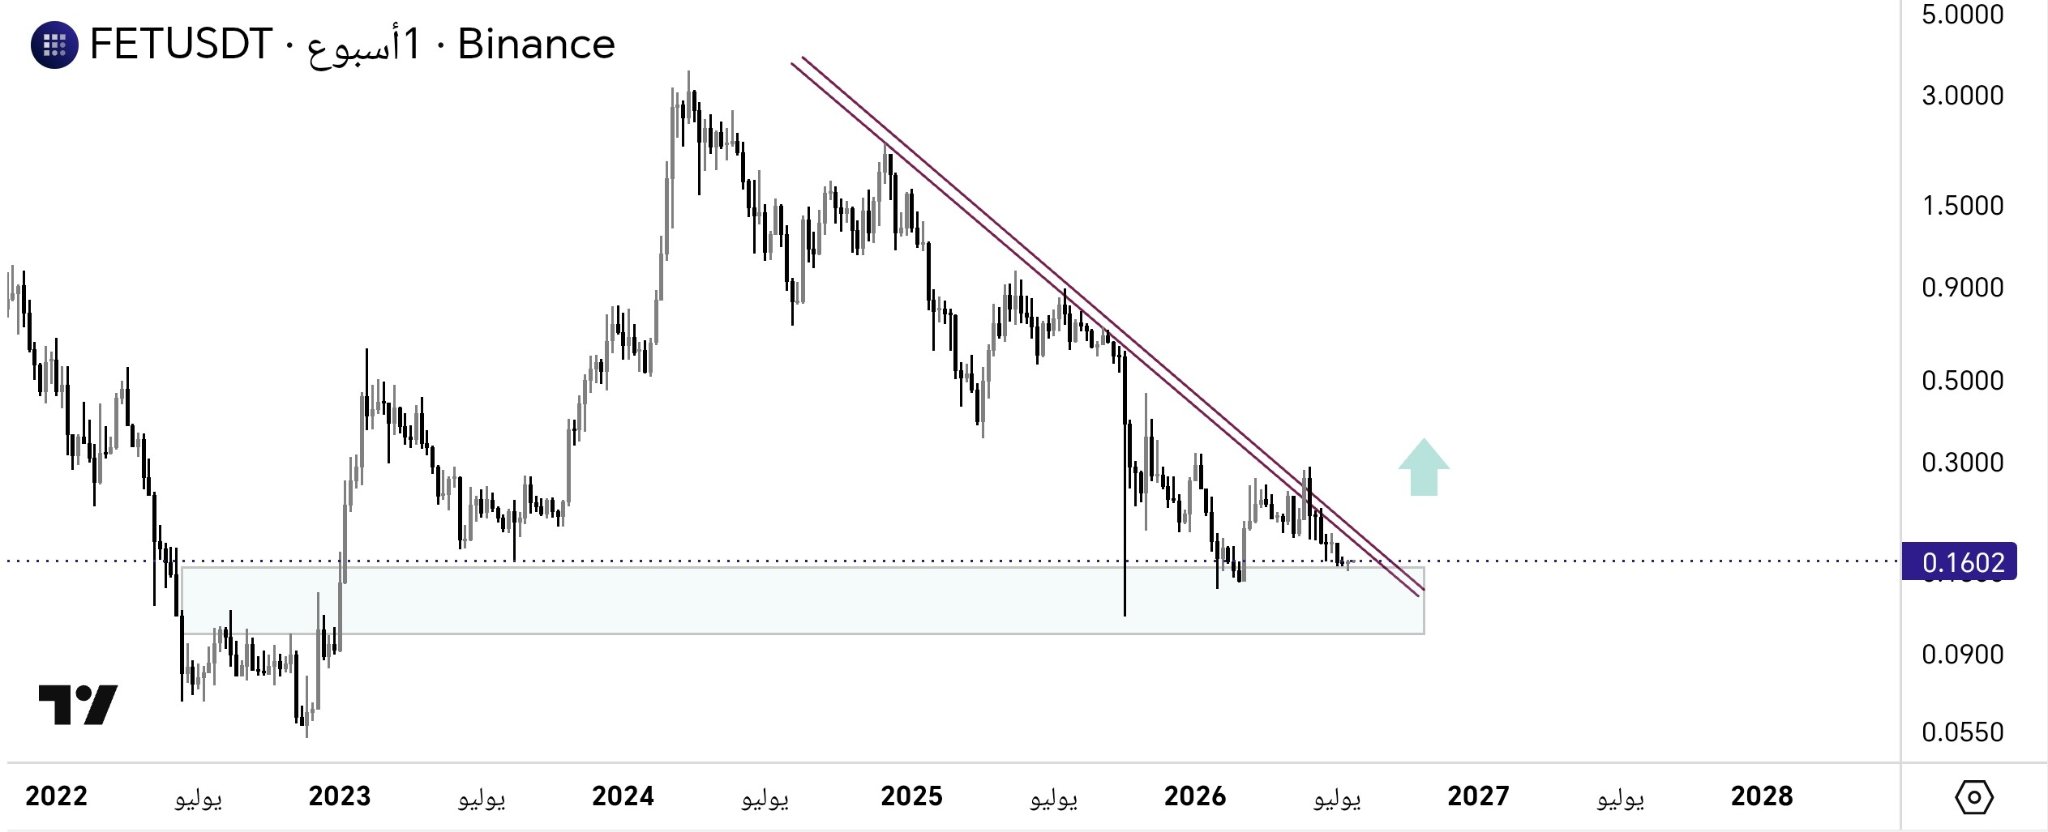
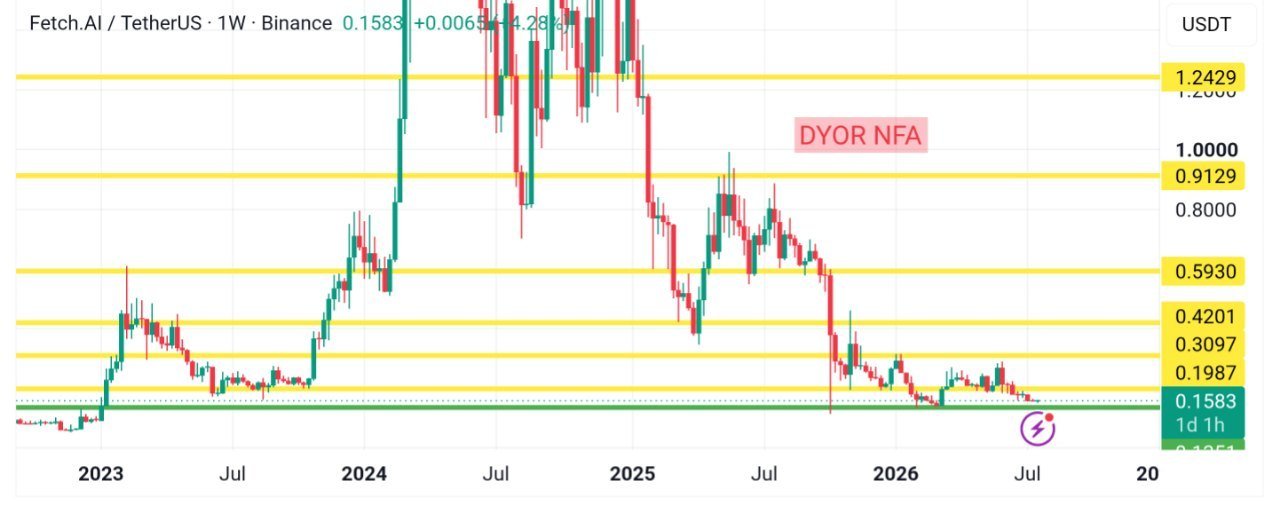
    #FET | $FET For people who ask whether the coin will rise to $5 We should be realistic: such an increase is impossible in the medium term You have a strong downtrend on the weekly chart; if it breaks, we could target $0.50 then $1.00 Start trading today with the best platform #Binance https://t.co/UeLFwB41eq

    AYMAN TA_Analyst Trader S
     3.75K  @Crypto_Ayman

    $FET... 📈

     80  3  6.02K
    Leer original >
    Tendencia de FET tras el lanzamiento
     Bajista
    FET is unlikely to reach $5 in the medium term; it needs to break the weekly downtrend line before aiming for $0.5‑$1.
  • AYMAN TA_Analyst Trader S
     3.75K  @Crypto_Ayman

    $FET... 📈

     86  2  10.69K
    Leer original >
    Tendencia de FET tras el lanzamiento
     Alcista
    FET is unlikely to reach $5 in the medium term; it needs to break the weekly downtrend line before aiming for $0.5‑$1.
  • AYMAN TA_Analyst Trader S
     3.75K  @Crypto_Ayman

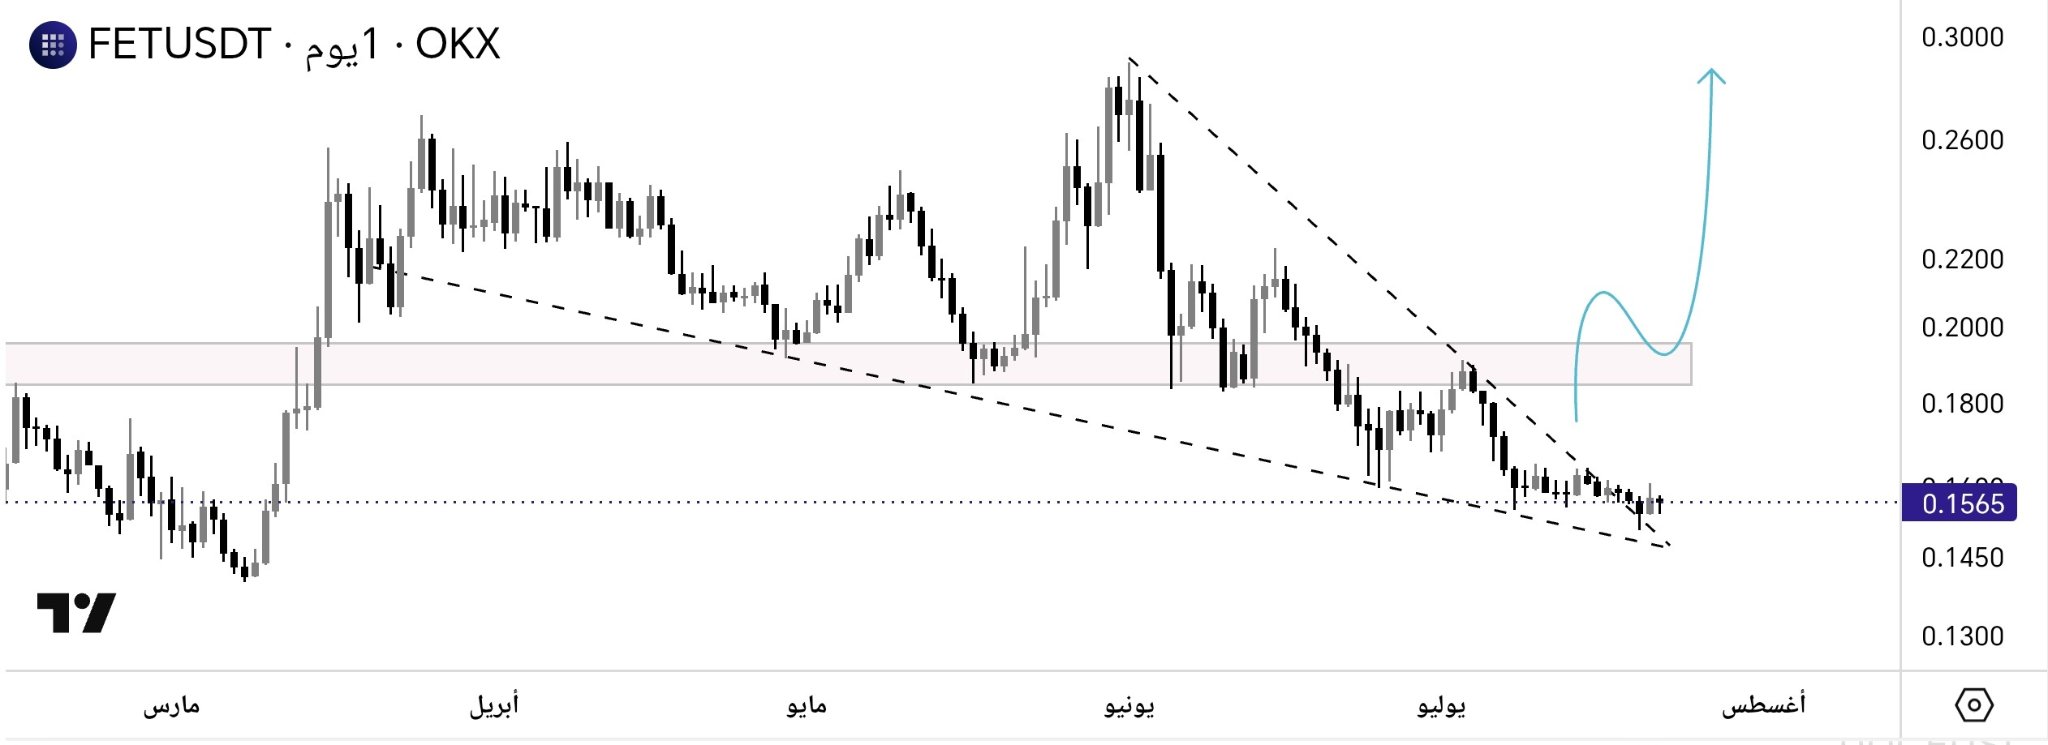
    #FET | $FET As long as the price stays above the breakout target area, the red box is the biggest reversal zone The red box is the largest reversal zone 🚀 https://t.co/CYDhJUtBCx

    AYMAN TA_Analyst Trader S
     3.75K  @Crypto_Ayman

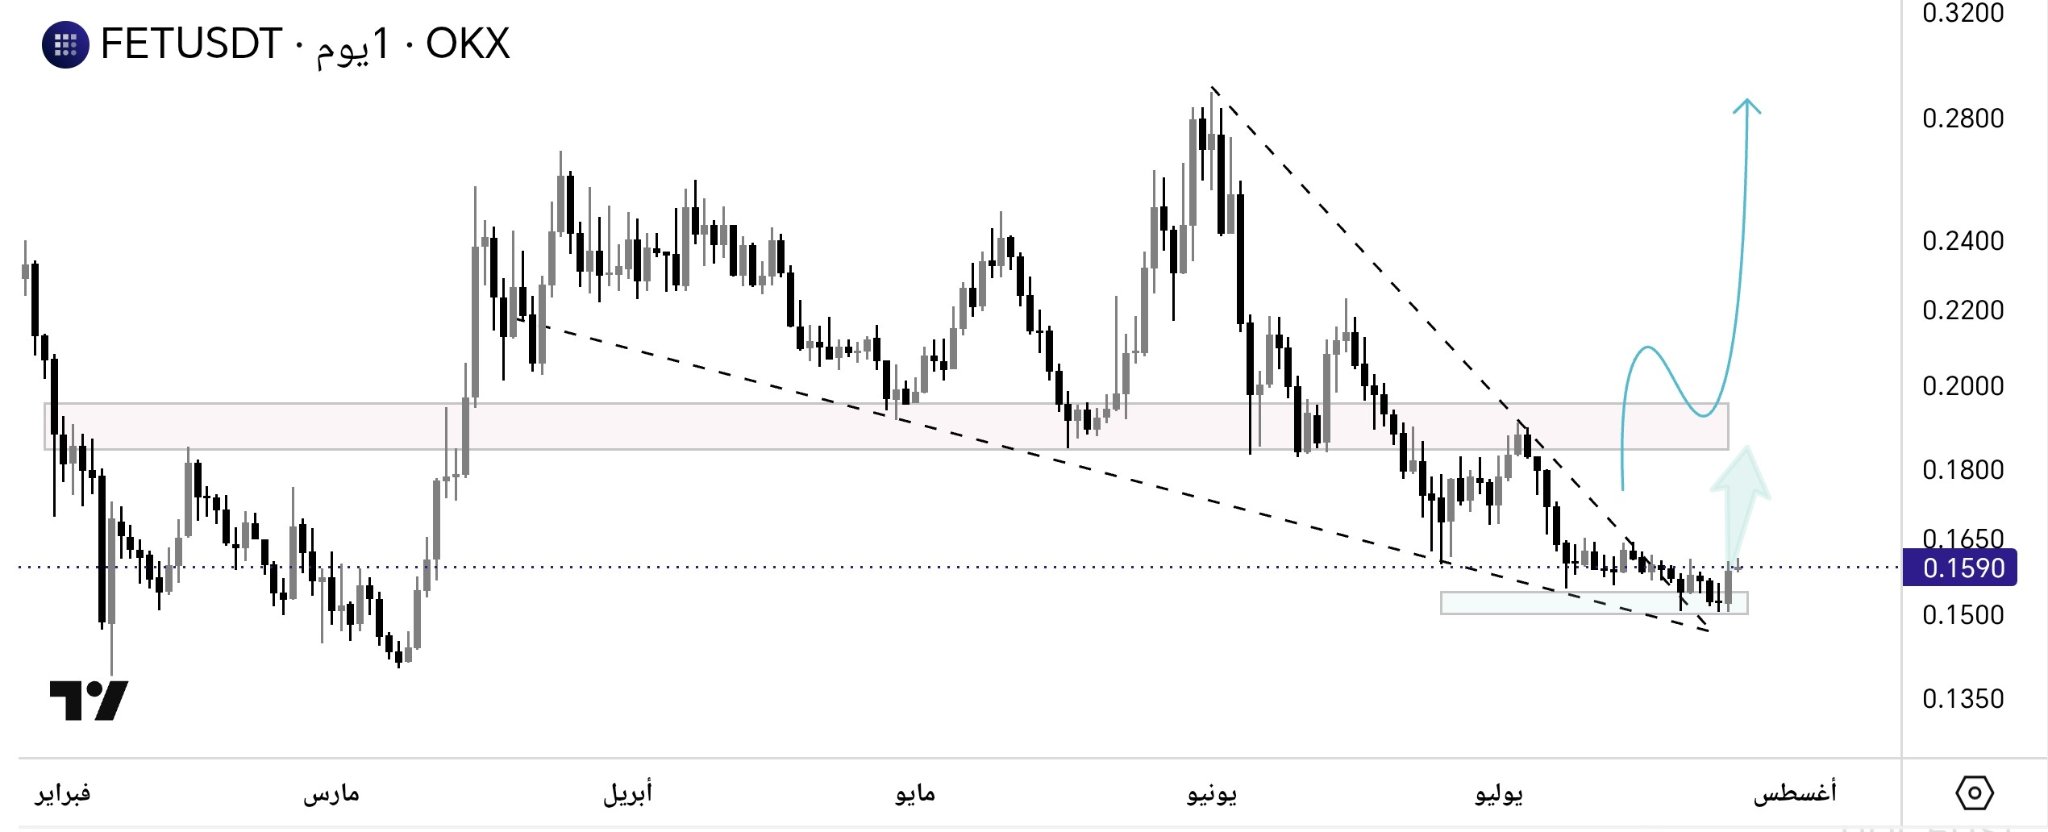
    #FET | $FET The break of the steady descending wedge is an opportunity for an upward move .. 📡 And the next hurdle is the red box https://t.co/Tn5mYAplGA

     87  4  8.15K
    Leer original >
    Tendencia de FET tras el lanzamiento
     Extremadamente alcista
    FET breaks out of a descending wedge, expected to surge significantly to a key red zone.
  • AYMAN TA_Analyst Trader S
     3.75K  @Crypto_Ayman
    AYMAN TA_Analyst Trader S
     3.75K  @Crypto_Ayman

    #FET | $FET The break of the steady descending wedge is an opportunity for an upward move .. 📡 And the next hurdle is the red box https://t.co/Tn5mYAplGA

     76  5  17.97K
    Leer original >
    Tendencia de FET tras el lanzamiento
     Alcista
    FET breaks the descending wedge, indicating an upward opportunity, with the next resistance in the red box area shown in the chart.
  • The Boss 🦅 TA_Analyst Influencer B
     88.45K  @CryptoTheBossX

    🔷️ $FET 's weekly chart is no longer about momentum it's about survival. 📉 After the explosive AI-driven rally, the market gradually lost its higher-timeframe structure and entered a prolonged distribution phase. Every recovery attempt has been met with selling pressure, leaving price trapped near a major historical demand zone where buyers are once again trying to stabilize the market. ⚖️ This area deserves attention, but support alone is not a bullish signal. What matters now is whether accumulation can finally replace persistent selling. Until the market begins reclaiming lost structure, caution remains more valuable than optimism. ‼️ Since #FET is the subject of this analysis, mentioning it is unavoidable. Therefore, this post should not be considered paid advertising, but rather unavoidable unpaid promotion. ⚠️ Not financial advice. #FET #AI #Crypto #Altcoins

     203  35  23.92K
    Leer original >
    Tendencia de FET tras el lanzamiento
     Bajista
    FET has been in a long-term downtrend, sitting in a historic demand zone, but the author warns to be cautious as bearish sentiment is strong.
  • @TakeProfitNow D
     1.15K  @TakePr0fitN0w

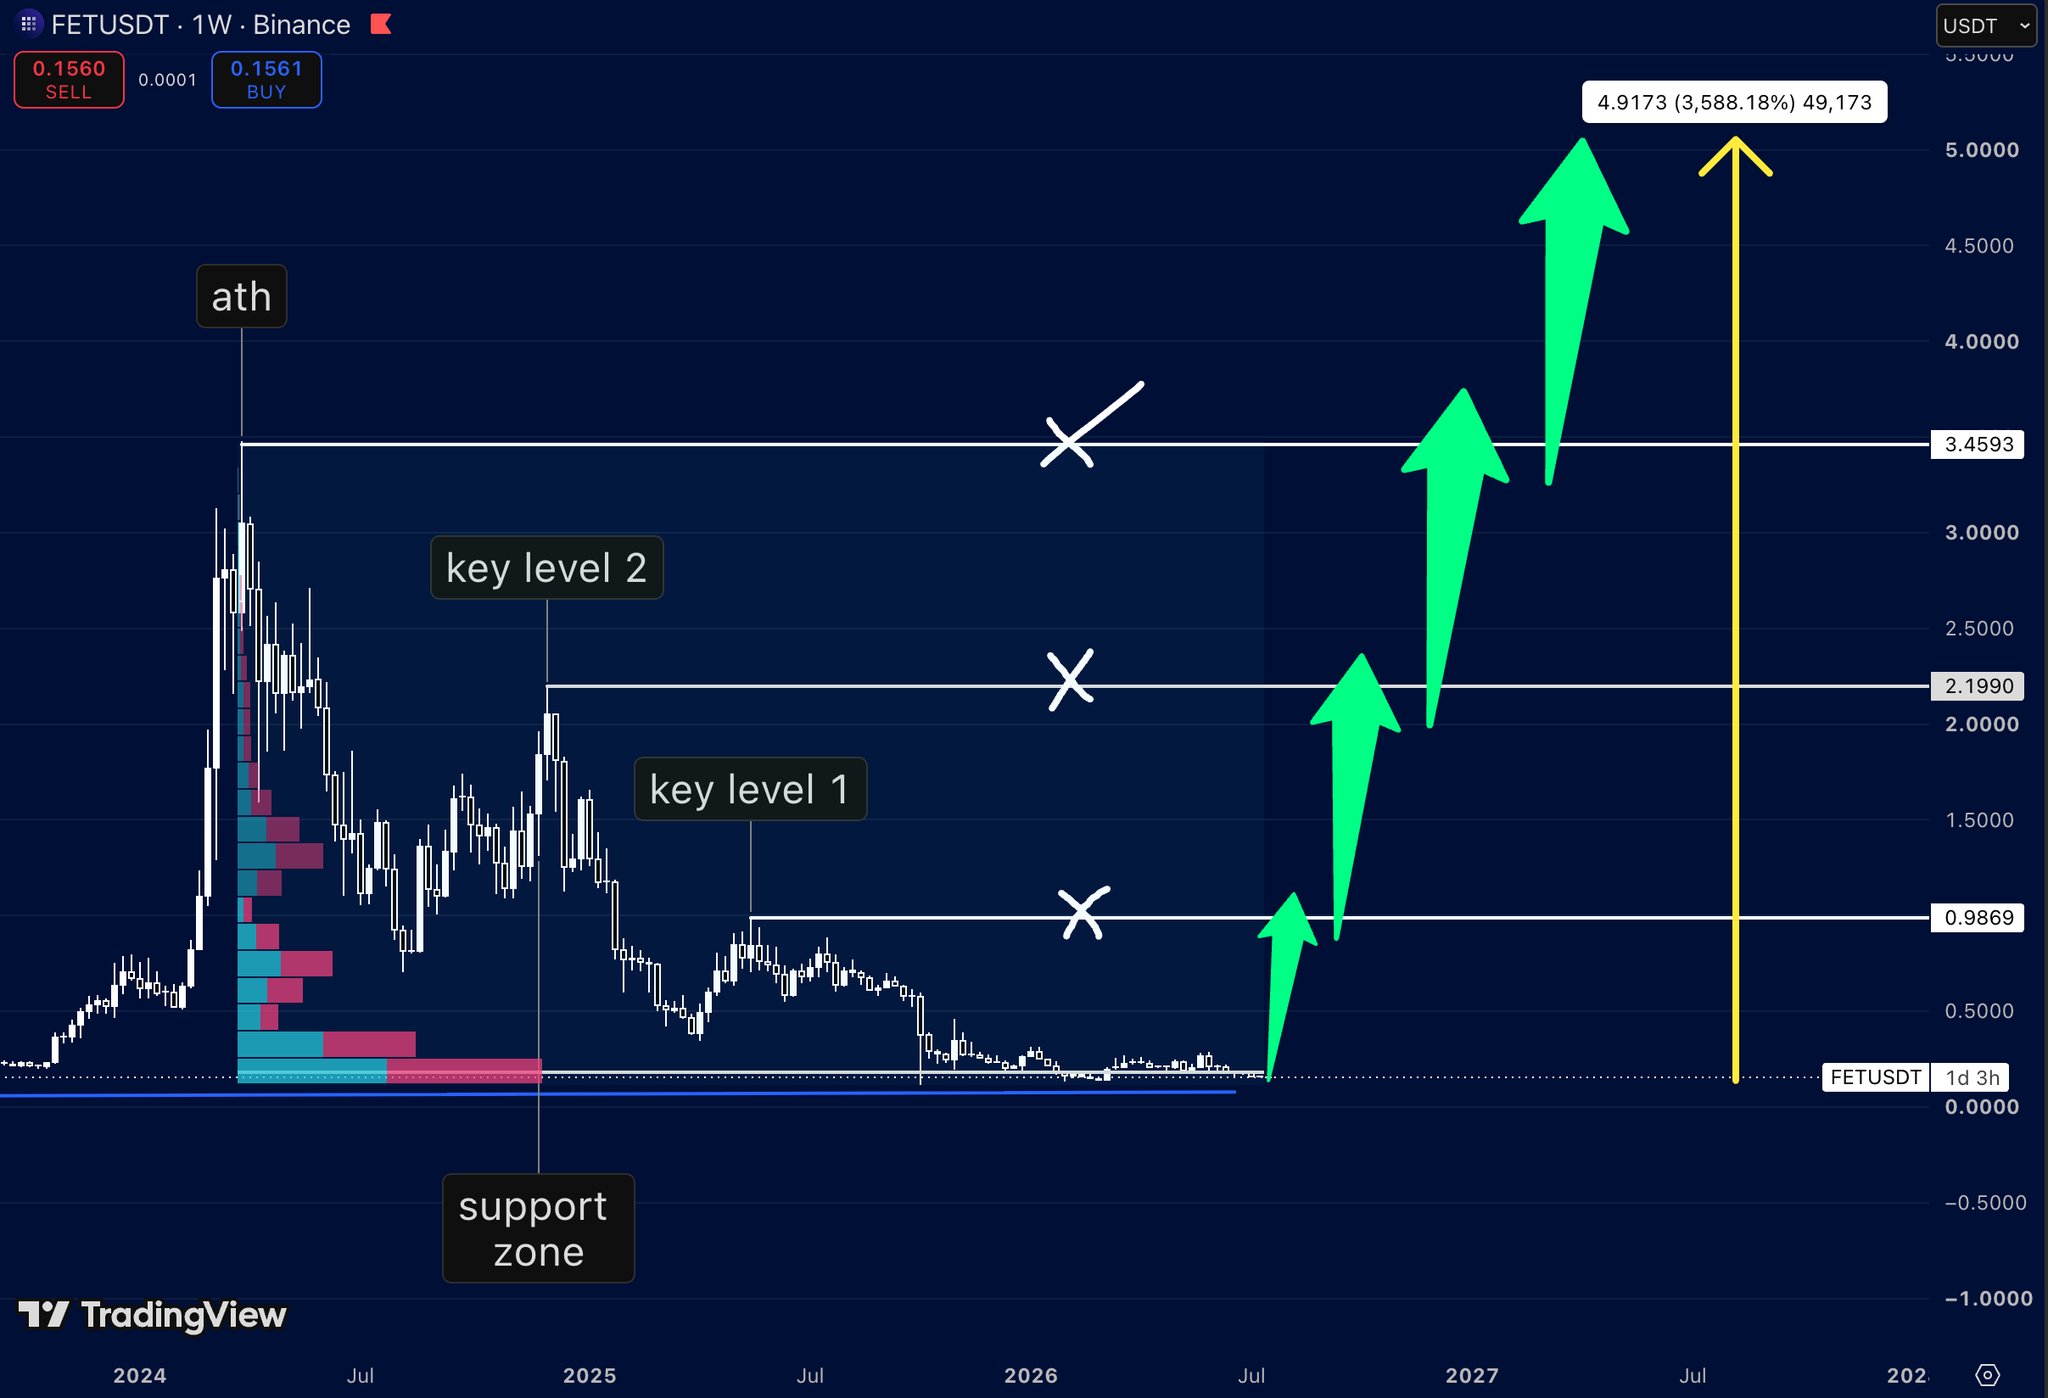
    $FET is trading above a major long-term support zone, with several key resistance levels defining the next bullish expansion. After a prolonged correction, price has stabilized near the lows and continues to defend the same area where buyers have repeatedly stepped in. As long as this support holds, the higher-timeframe structure remains constructive. The first major target sits around $0.99. This level previously acted as an important support before the breakdown, making it the first key resistance buyers need to reclaim. A successful breakout above $0.99 would significantly strengthen bullish momentum. The next objective is located near $2.20. This zone marked a major consolidation area during the previous cycle and could temporarily slow the advance as sellers return. If bulls manage to reclaim $2.20, attention shifts toward the final resistance. The highest target stands around $3.46, which represents the previous all-time high region. Breaking above this level would complete the recovery from the bear market and potentially send FET into price discovery. The projected move toward the final target represents approximately +3,600%, making FET one of the strongest long-term recovery setups in the AI sector if the broader market remains supportive

     264  27  9.90K
    Leer original >
    Tendencia de FET tras el lanzamiento
     Extremadamente alcista
    FET holds long-term support, with potential to break to a new historical high, targeting a gain of over 3600%.
  • More Crypto Online TA_Analyst Educator C
     52.96K  @Morecryptoonl

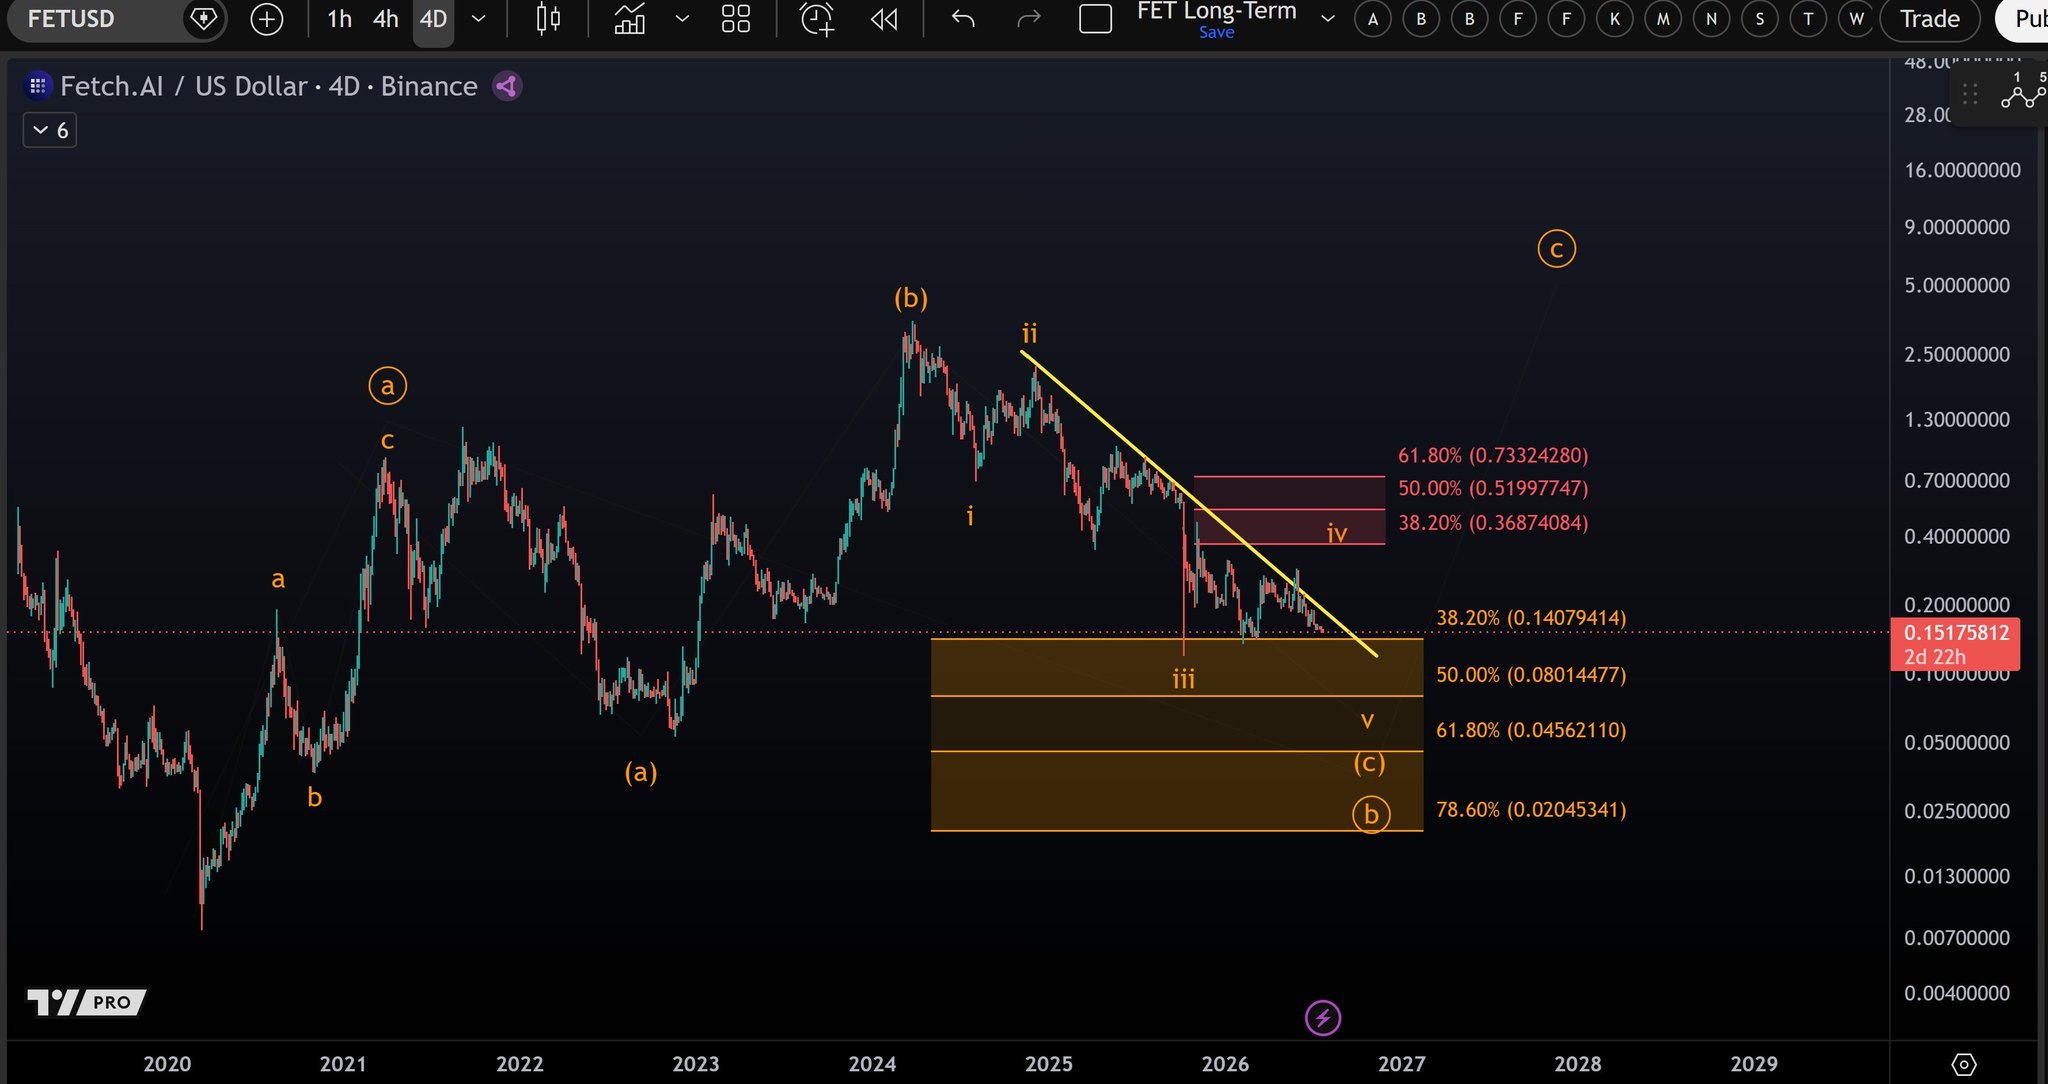
    $FET https://t.co/LsaLGAonHz remains under downside pressure, with the broader correction from the March 2024 high still favoring a larger 5-wave decline. https://t.co/Rqbjx4EDPX

     106  9  12.18K
    Leer original >
    Tendencia de FET tras el lanzamiento
     Extremadamente bajista
    FET faces downside pressure, technical analysis shows a 5-wave downtrend starting from the March 2024 high.