 Near Protocol (NEAR)
$1.700 -0.41% 24H
- 72Índice de sentimiento social (ISS)+29.50% (24h)
- #40Clasificación del pulso del mercado (CPM)+14
- 18Mención en redes sociales de 24 h+12.50% (24h)
- 83%Ratio alcista de KOL en 24 h13 KOL activo
- Resumen
- Señales alcistas
- Señales bajistas
Índice de sentimiento social (ISS)
- Datos generales72SSI
- Tendencia ISS (7 días)Precio (7 días)Distribución de sentimientosExtremadamente alcista (44%)Alcista (39%)Bajista (17%)Perspectivas de ISS
Clasificación del pulso del mercado (CPM)
- Alerta Insight
Publicaciones de X
 EMK TA_Analyst Trader B6.69K @emkfinans

 EMK TA_Analyst Trader B6.69K @emkfinans3 0 348 Leer original >Tendencia de NEAR tras el lanzamientoExtremadamente bajista
- Tendencia de NEAR tras el lanzamientoAlcista
 Vadim (AI, ⋈) Security_Expert OnChain_Analyst S12.83K @zacodil
 Vadim (AI, ⋈) Security_Expert OnChain_Analyst S12.83K @zacodil14 2 300 Leer original >Tendencia de NEAR tras el lanzamientoExtremadamente alcista
 𝒫𝓊𝒻𝒾 TA_Analyst Trader C6.39K @kriptopufi
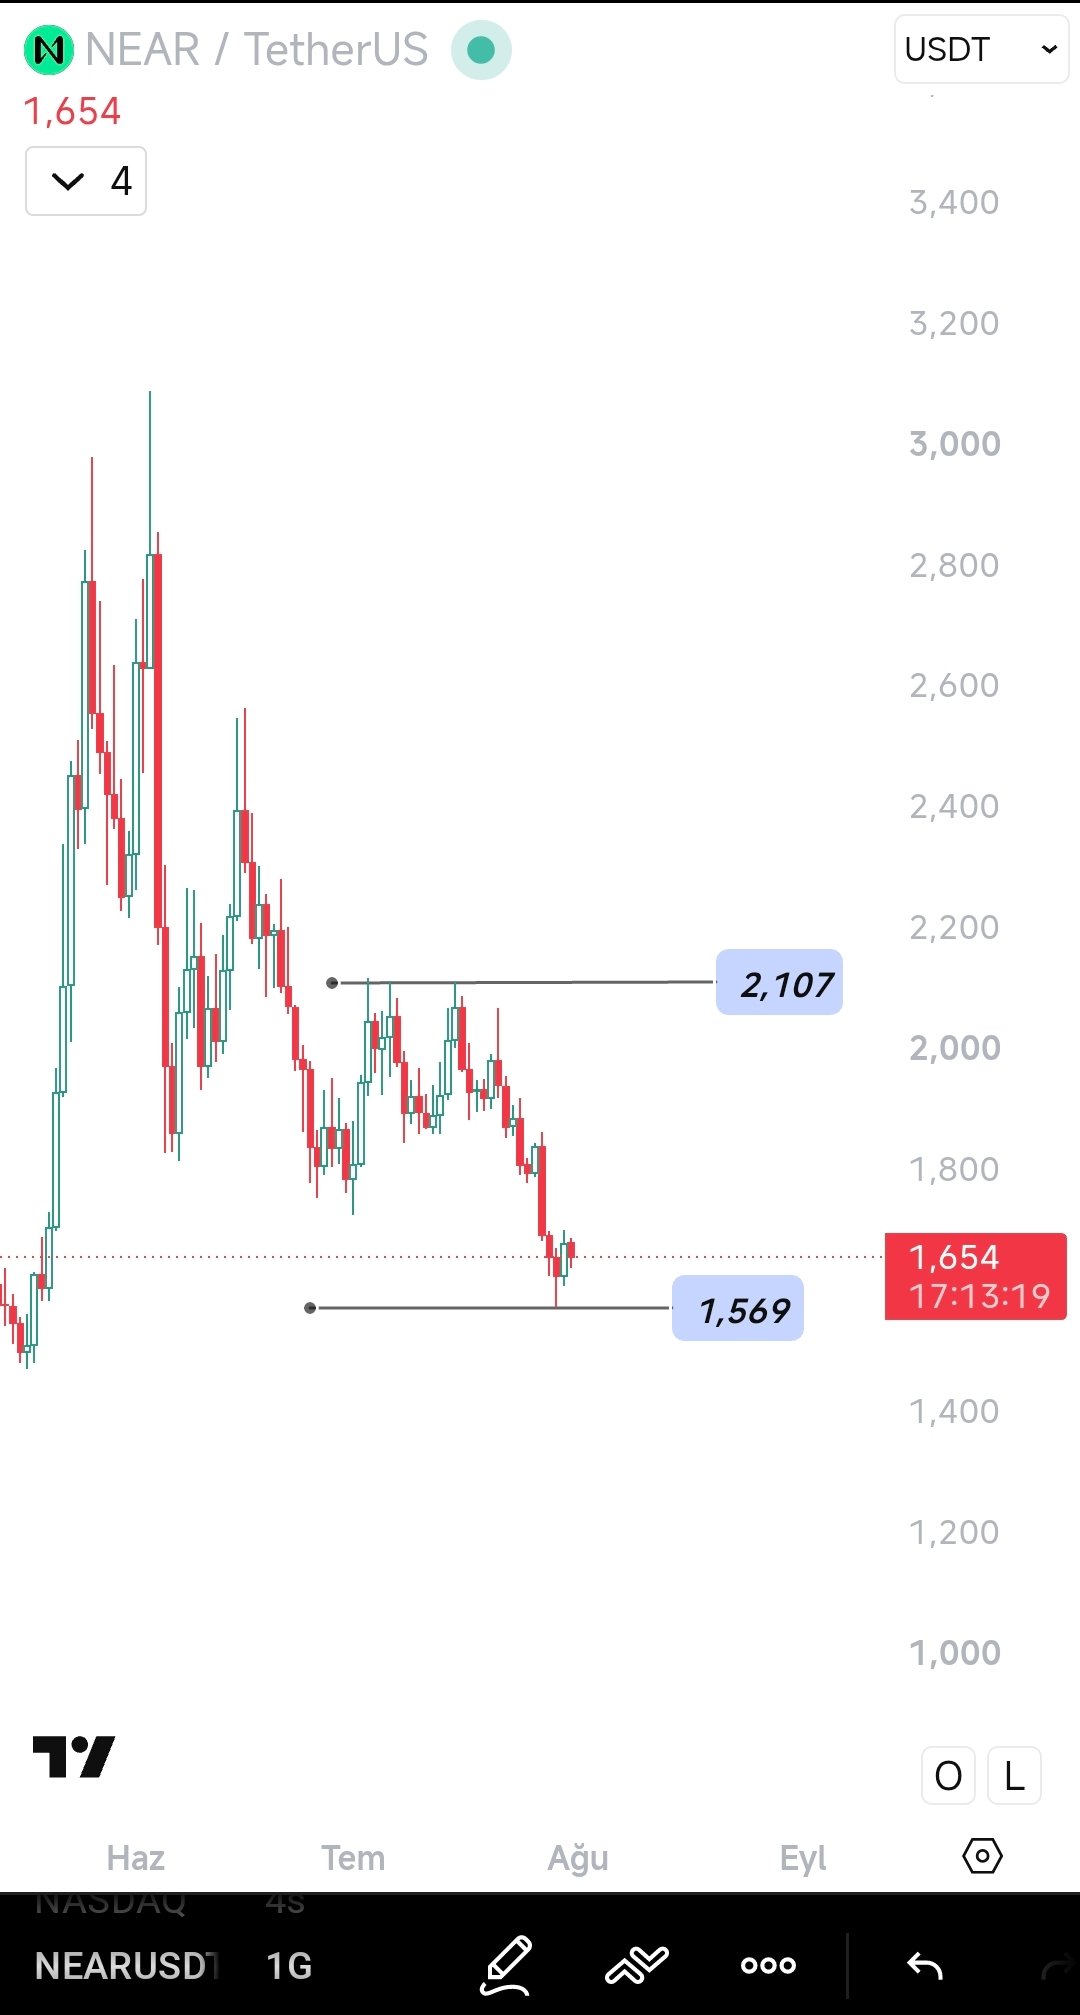 𝒫𝓊𝒻𝒾 TA_Analyst Trader C6.39K @kriptopufi
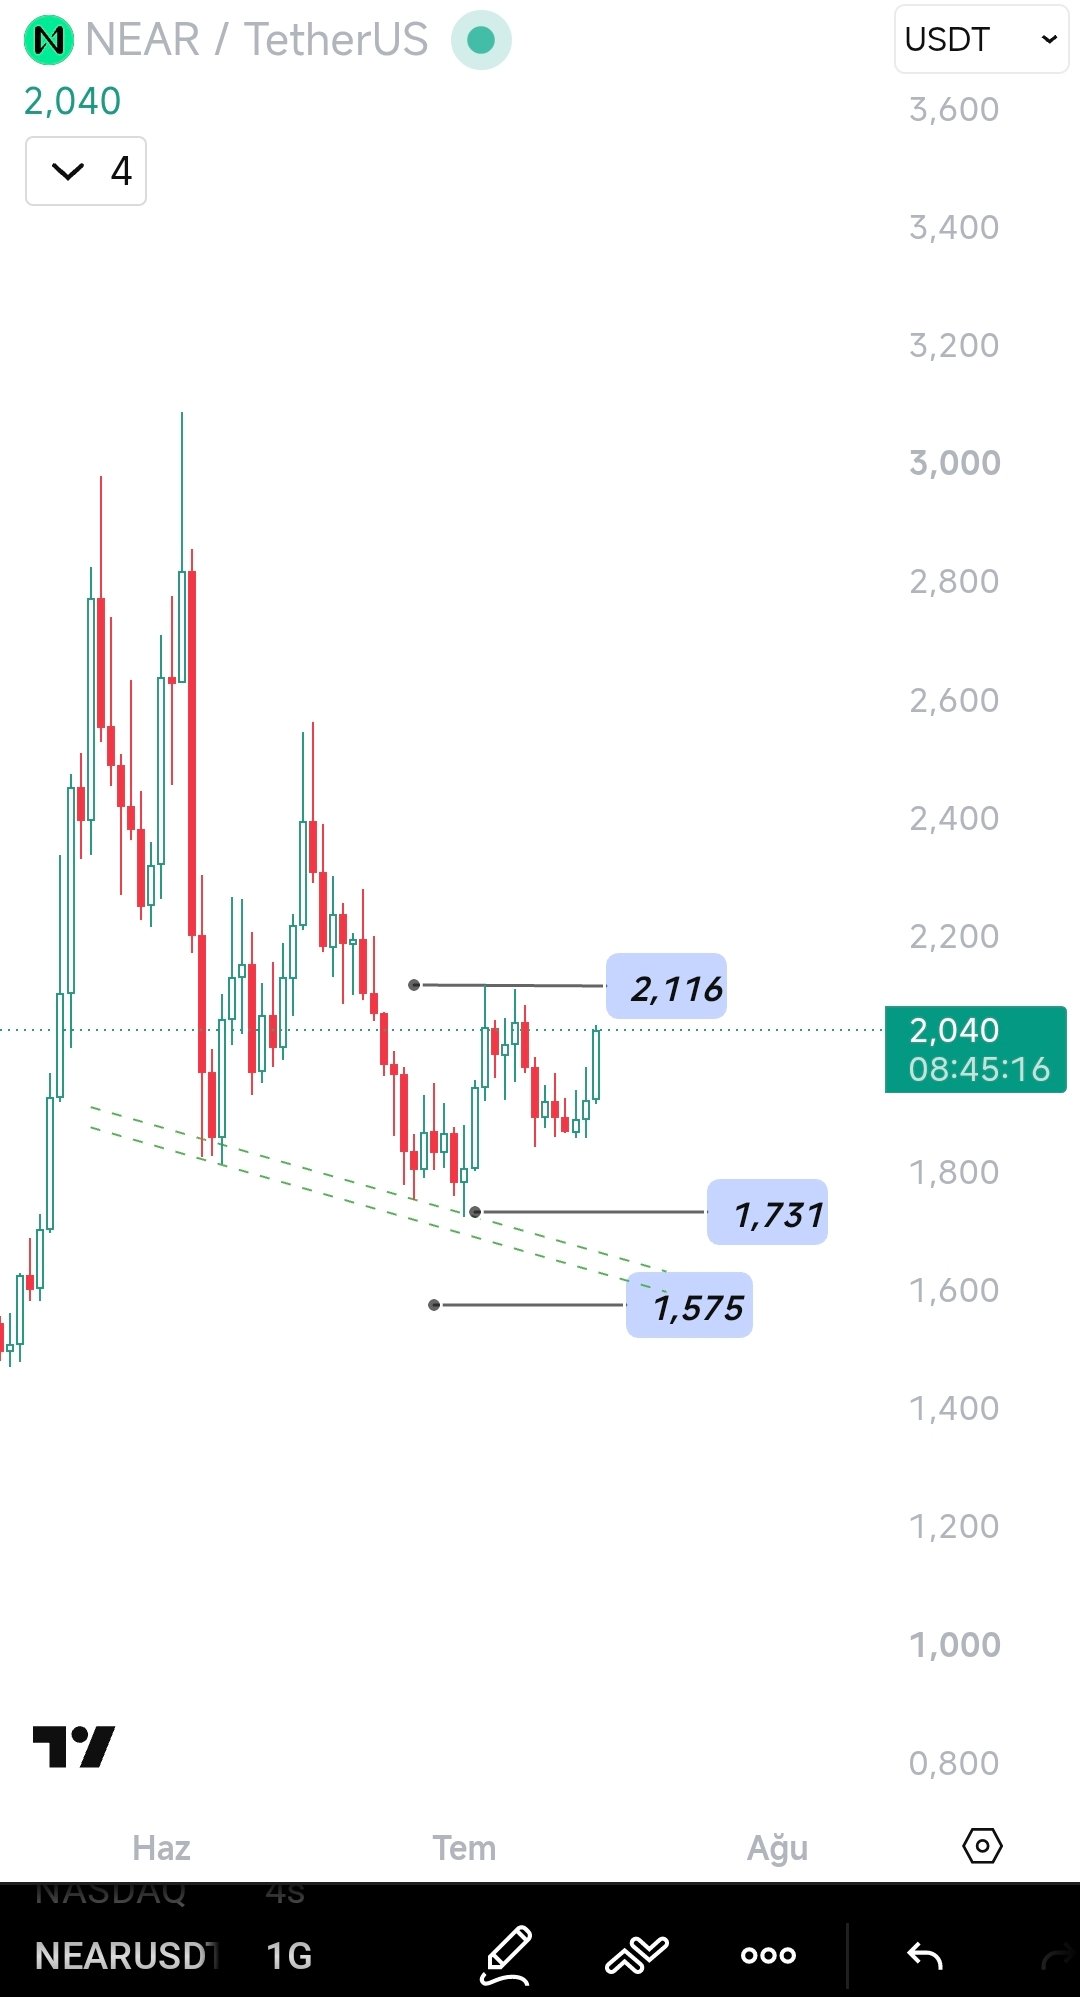 1 0 188 Leer original >Tendencia de NEAR tras el lanzamientoAlcista
 Vini B |「 thecoding 」 Educator Security_Expert B11.71K @vinibarbosabrVini B |「 thecoding 」 Educator Security_Expert B11.71K @vinibarbosabr46 1 1.63K Leer original >Tendencia de NEAR tras el lanzamientoExtremadamente alcista
 NEAR Protocol DeFi_Expert Security_Expert C1.84M @NEARProtocolNEAR Protocol DeFi_Expert Security_Expert C1.84M @NEARProtocolNEAR Protocol DeFi_Expert Security_Expert C1.84M @NEARProtocol
 NEAR Protocol DeFi_Expert Security_Expert C1.84M @NEARProtocolNEAR Protocol DeFi_Expert Security_Expert C1.84M @NEARProtocolNEAR Protocol DeFi_Expert Security_Expert C1.84M @NEARProtocol203 13 103.93K Leer original >Tendencia de NEAR tras el lanzamientoExtremadamente alcista
 Satoshi Flipper Trader TA_Analyst C239.80K @SatoshiFlipper
 Satoshi Flipper Trader TA_Analyst C239.80K @SatoshiFlipper
 57 6 10.98K Leer original >Tendencia de NEAR tras el lanzamientoExtremadamente alcista
- Tendencia de NEAR tras el lanzamientoExtremadamente alcista
 David Hoffman Influencer Media C256.70K @TrustlessStateNEAR Protocol DeFi_Expert Security_Expert C1.84M @NEARProtocol539 27 316.61K Leer original >Tendencia de NEAR tras el lanzamientoAlcista
- Vadim (AI, ⋈) Security_Expert OnChain_Analyst S12.83K @zacodilNEAR Protocol DeFi_Expert Security_Expert C1.84M @NEARProtocol59 5 1.65K Leer original >Tendencia de NEAR tras el lanzamientoAlcista


 MALFOY 🐍 SExtremadamente alcista
- Vadim (AI, ⋈) SExtremadamente alcista
 chief of overthinking AExtremadamente alcista
 Vini B |「 thecoding 」 BExtremadamente alcista
 𝙳𝚎𝚏𝚒 𝙿𝚛𝚒nter 👨🎤 BBajista
 David Hoffman CAlcista
 CExtremadamente alcista
 Satoshi Flipper CExtremadamente alcista
 Ali Charts CAlcista
 More Crypto Online CBajista