Se lancer
Scanner pour télécharger l'application
iOS et Android
BitMart / Crypto / RGTI

Rigetti Computing Tokenized Stock (Robinhood) (RGTI)

$
$ 18.74 (RGTI/USD)
0.59%
24H

Rigetti Computing Tokenized Stock (Robinhood) Données sur les prix en temps réel

Le prix de Rigetti Computing Tokenized Stock (Robinhood) aujourd'hui est $ 18.74 (RGTI/USD). Avec une capitalisation boursière de $ 5,588.96 USD. Volume de trading de $ 0 USD sur 24 heures, Un changement de prix de +0.59% sur 24 heures, Et une réserve circulante de 298.24 RGTI.

Rigetti Computing Tokenized Stock (Robinhood) RGTI Historique des prix USD

Suivez le prix de Rigetti Computing Tokenized Stock (Robinhood) aujourd’hui, dans 7 jours, 30 jours et 90 jours
Période
Modifier
Variation (en pourcentage)
Aujourd'hui
$ 0.10
0.59%
7Jours
$ 0.29
1.62%
30Jours
$ 0.29
1.62%
90Jours
$ 0.29
1.62%

Possédez RGTI dès maintenant

Achetez et vendez RGTI facilement et en toute sécurité sur BitMart.
Acheter/vendre RGTI maintenant
Acheter/vendre {0} maintenant
Rigetti Computing Tokenized Stock (Robinhood) Informations sur le marché
Dernier prix $ 18.74
$ 18.63 Fourchette de prix sur 24 heures $ 18.79
Record absolu
‎$ 19.33‎
Plus bas niveau jamais atteint
‎$ 17.63‎
Variation sur 24 heures
‎0.59%‎
Volume sur 24 h
‎$ 0‎
Approvisionnement en circulation
298.24 RGTI
Capitalisation boursière
‎$ 5,588.96‎
Approvisionnement maximal
--
Capitalisation boursière entièrement diluée
‎$ 5,588.96‎
Trader RGTI

Gagner

Faites fructifier vos cryptomonnaies et générez des revenus passifs grâce à l'épargne, au staking, et plus encore.
Essayez maintenant
Essayez maintenant

Rigetti Computing Tokenized Stock (Robinhood) X Insight

avatar
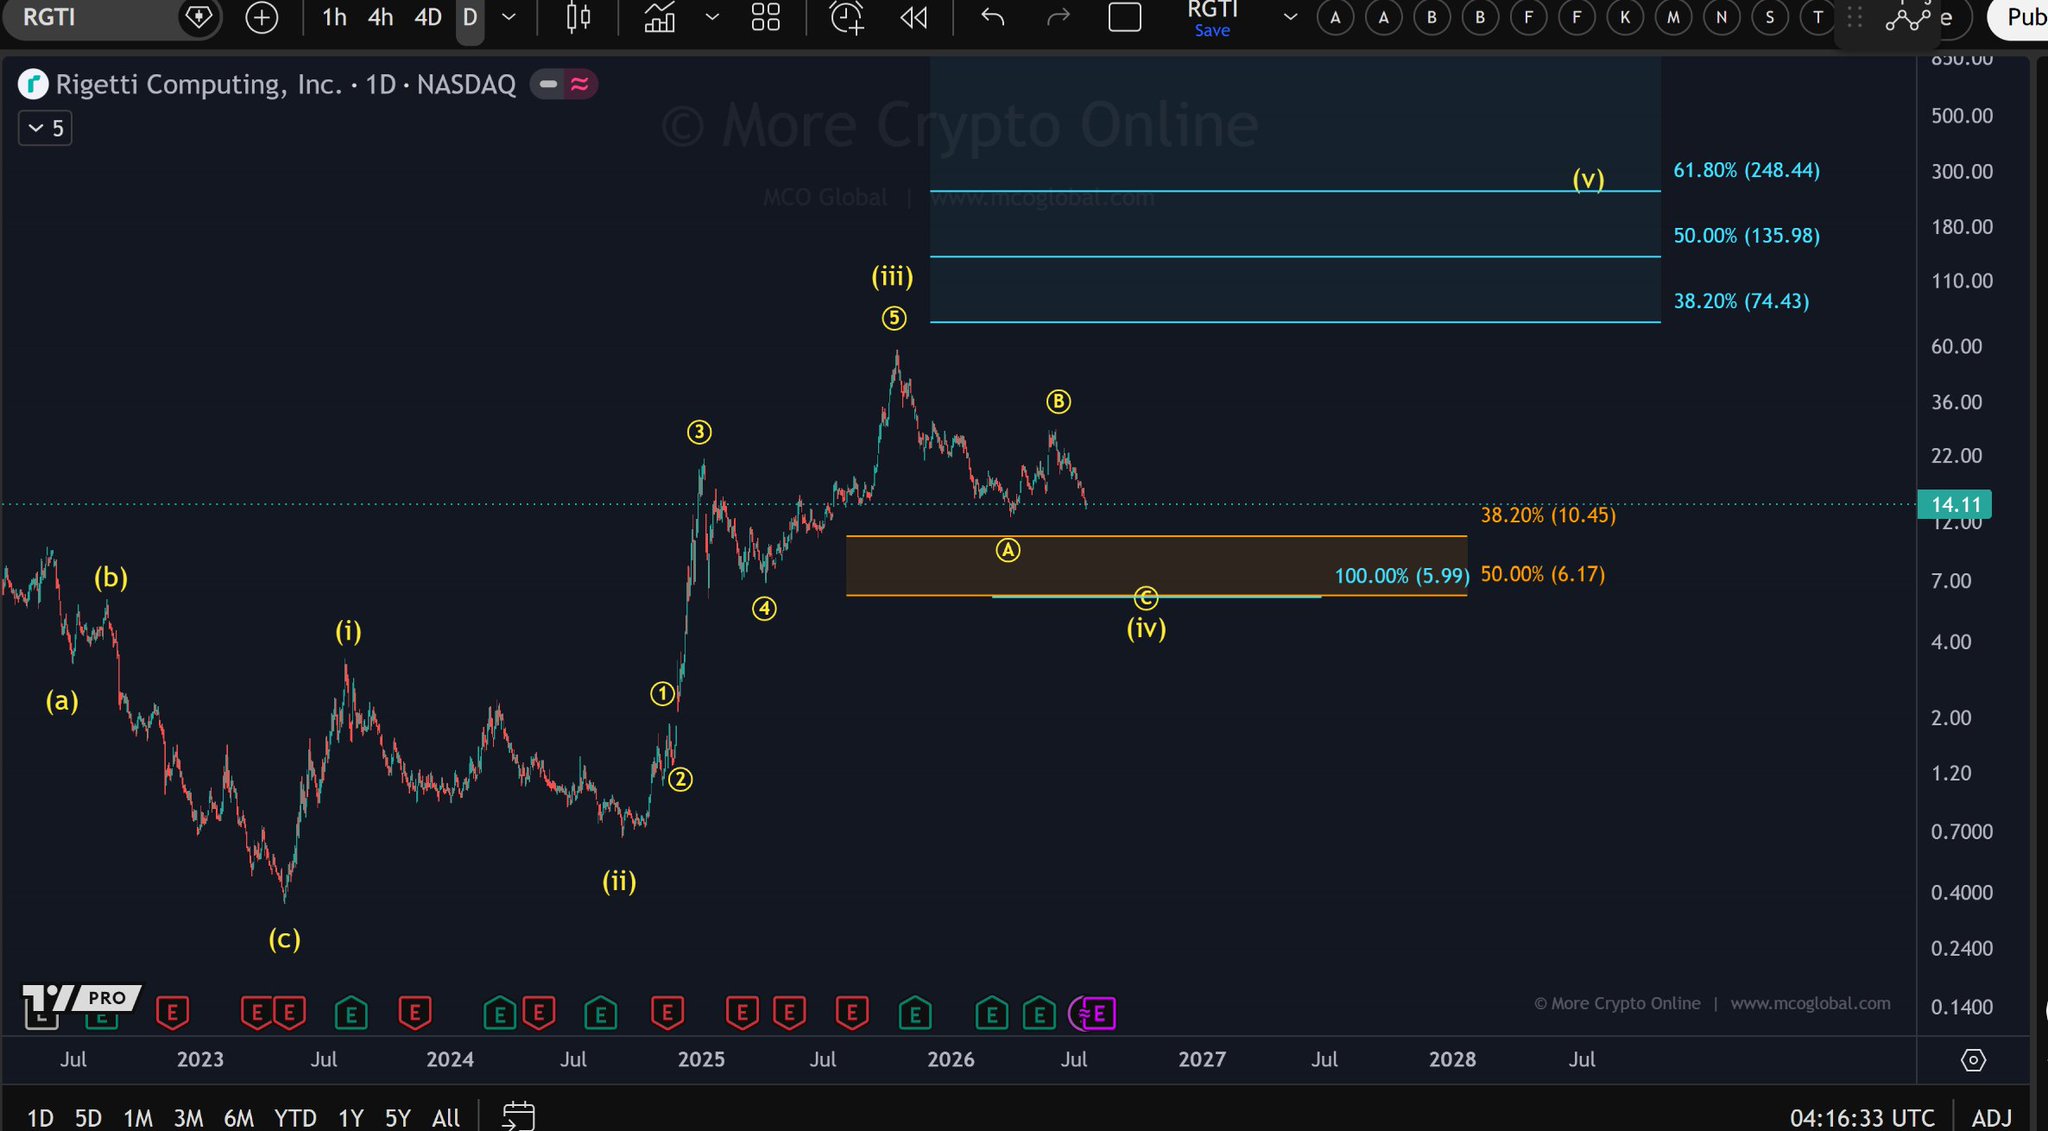
RGTI is in a correction phase, expected to fall to the $5.99-$10.45 support zone.

$RGTI
RGTI remains in a correction phase from the peak of wave (iii), and the move from the peak of wave B still aligns with a still-unfinished decline of wave C.
Leading scenario: The preferred view is that wave (iv) is still incomplete. The decline from the peak of wave B could continue towards the orange support zone between 10,45 $ and 6,17 $, with the 100% C-wave extension around 5,99 $. A move into this area would still fit the structure of the correcting wave (iv) and would not invalidate the count.
Risk scenario: Should the price reverse strongly before reaching the lower support zone and rise back above the recent recovery high, wave (iv) may have completed earlier than expected. On the downside, a sustained break below the 6 $ region would make the correction deeper than ideal and increase the likelihood of a more complex structure.
Key support levels: 10,45 $ / 6,17 $ / 5,99 $ Key resistance levels: 74,43 $ / 136 $ / 248 $ Conclusion: RGTI continues to be viewed as an unfinished (iv) correction wave, with the C-wave decline allowed to extend into the support zone of 10,45 $ to 5,99 $ before a larger (v) wave attempt becomes relevant.
view 22
view 1
view 2.3K
2026-07-18 07:12
Tendance de RGTI après le lancement
Baissier
RGTI is in a correction phase, expected to fall to the $5.99-$10.45 support zone.
avatar
RGTI and IONQ gain fresh attention, retail funds shift to quantum AI

🧠 Quantum names $RGTI and $IONQ are pulling fresh attention as retail rotates out of crowded mega-cap AI.

view 7
view 1
view 6.9K
2026-07-07 07:27
Tendance de RGTI après le lancement
Haussier
RGTI and IONQ gain fresh attention, retail funds shift to quantum AI
avatar
RGTI is hovering around the $15.30 support level, with a breakout still pending confirmation.

$RGTI
RGTI trades between the next support at $15.30 and the red Fibonacci resistance zone above it. The yellow and blue counts remain fairly balanced, with the proposed wave 1 circle still speculative and should be viewed more as a potential leading diagonal rather than a clear impulse.
Leading scenario: The yellow count can be seen as a possible 1-2 setup, with wave 2 circle still correcting after the rise in May. Holding the area around $15.30 would keep this structure intact, but the next upward attempt needs a stronger reaction before the bullish price gains weight. Risk scenario: Should the $15.30 level give way, the blue ABC interpretation becomes more likely. This would shift focus to the lower red support and possibly the orange support zone, where a C‑wave decline could develop before a larger trend reversal is attempted. Key support levels: $15.30 / ~$12.80 / $10.50–6.20
Key resistance levels: $27.11–49.17
Conclusion: For RGTI there is still no clear advantage between the yellow and blue scenarios. $15.30 is the first level that decides whether the potential 1-2 setup can hold or whether the deeper correction path takes precedence.

view 6
view 1
view 1.8K
2026-07-04 09:12
Tendance de RGTI après le lancement
Neutre
RGTI is hovering around the $15.30 support level, with a breakout still pending confirmation.
Détails
À propos Rigetti Computing Tokenized Stock (Robinhood)
Rigetti Computing Tokenized Stock (Robinhood) (RGTI) is a cryptocurrency and operates on the Robinhood Chain platform. Rigetti Computing Tokenized Stock (Robinhood) has a current supply of 298.239. The last known price of Rigetti Computing Tokenized Stock (Robinhood) is 17.98088664 USD and is down -3.72 over the last 24 hours. It is currently trading on 11 active market(s) with $0.00 traded over the last 24 hours. More information can be found at https://robinhood.com/us/en/.
En savoir plus