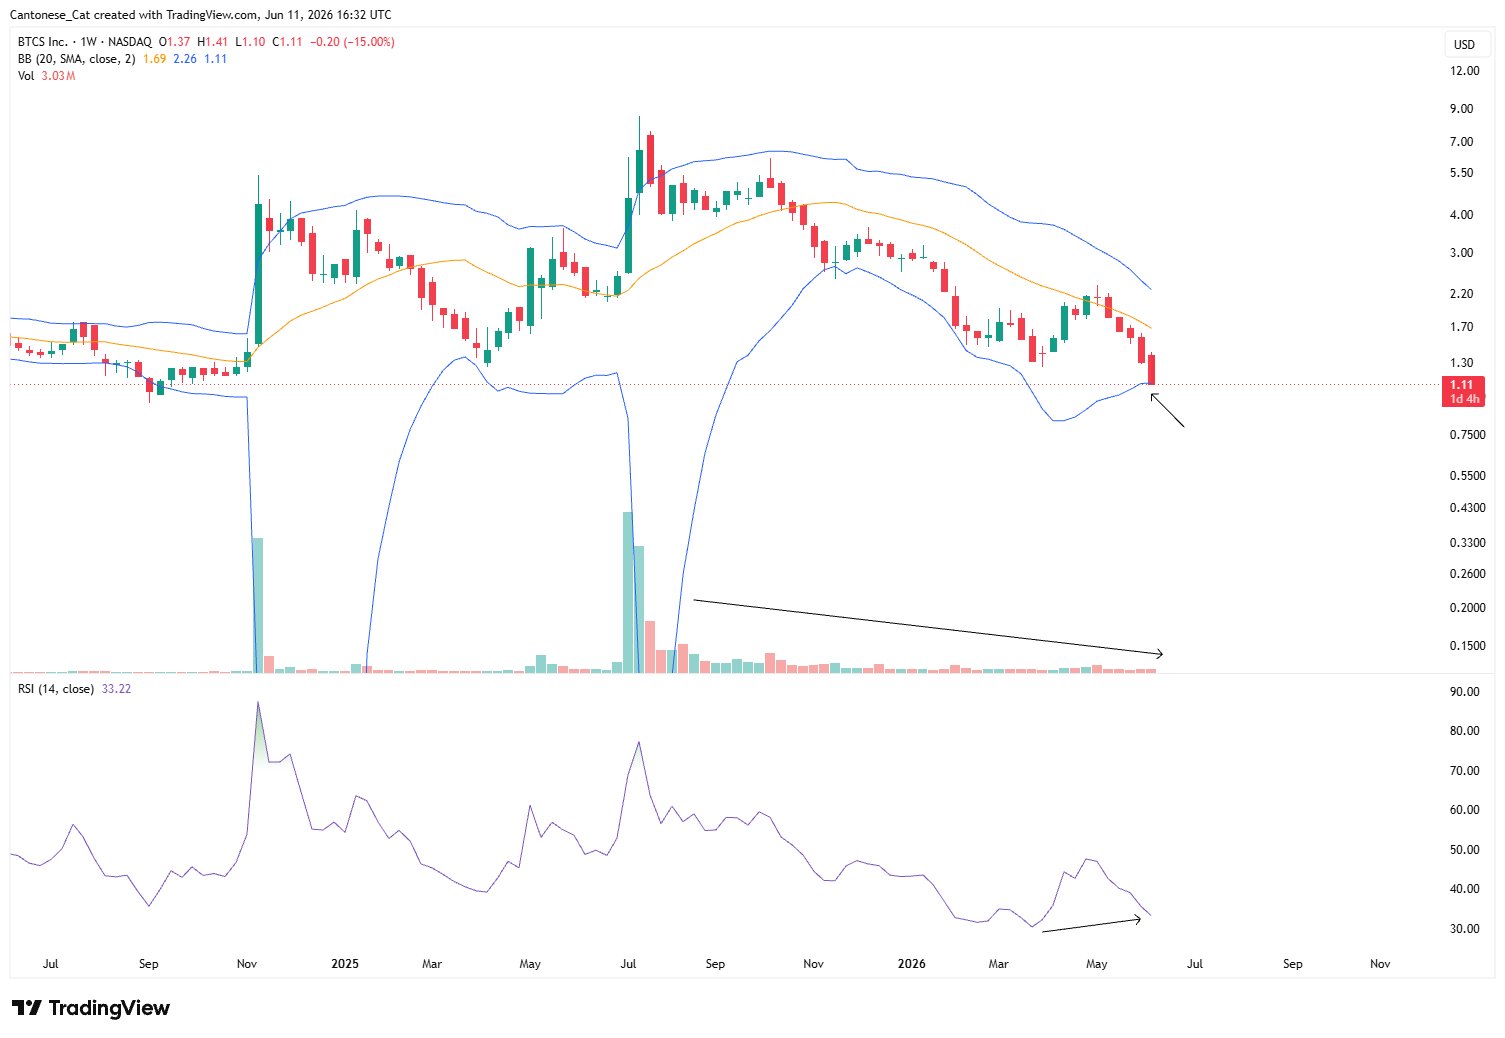
$BTCS weekly
The pain of low volume selling
Bullish divergence building
Tagging lower Bollinger band like the rest of crypto
Whatchagonnado, I'm adding slowly weekly so I can lose more dinero https://t.co/Jq9jA2Mpox


 87.5K @cantonmeow
 $BTCS weekly
The pain of low volume selling
Bullish divergence building
Tagging lower Bollinger band like the rest of crypto
Whatchagonnado, I'm adding slowly weekly so I can lose more dinero https://t.co/Jq9jA2Mpox
 84
84
 12
12
 5.8K
5.8K
 21.3K @chad_ventures
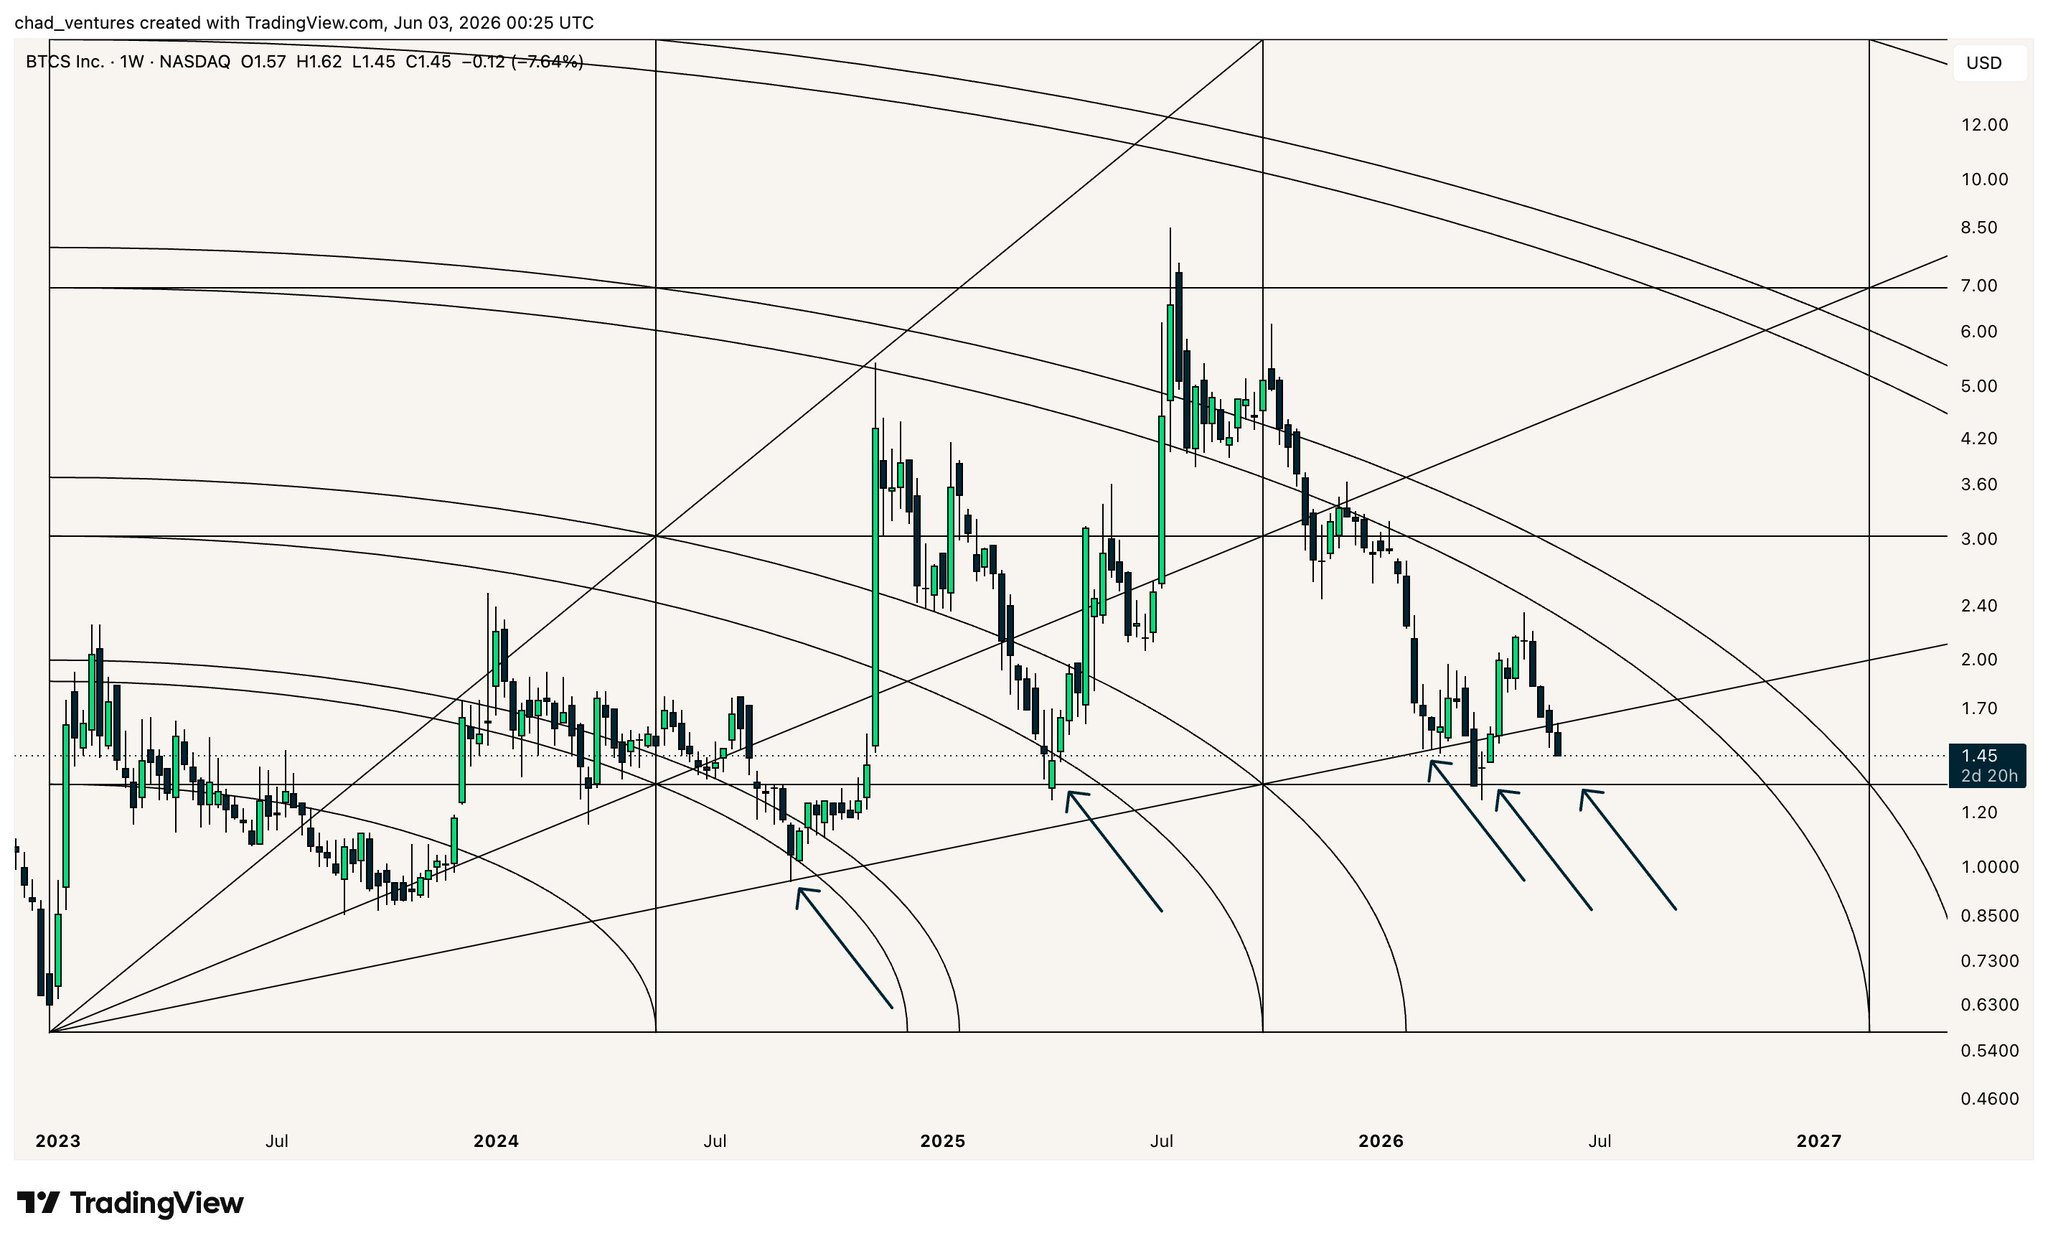
 $BTCS Weekly Gann Square
Do you really want to backtest the horizontal at $1.32 again?
Really?
Well, if that's the pain it needs, then go for it. https://t.co/ExFN70R2ZW
 44
3
3.0K
87.5K @cantonmeow
44
3
3.0K
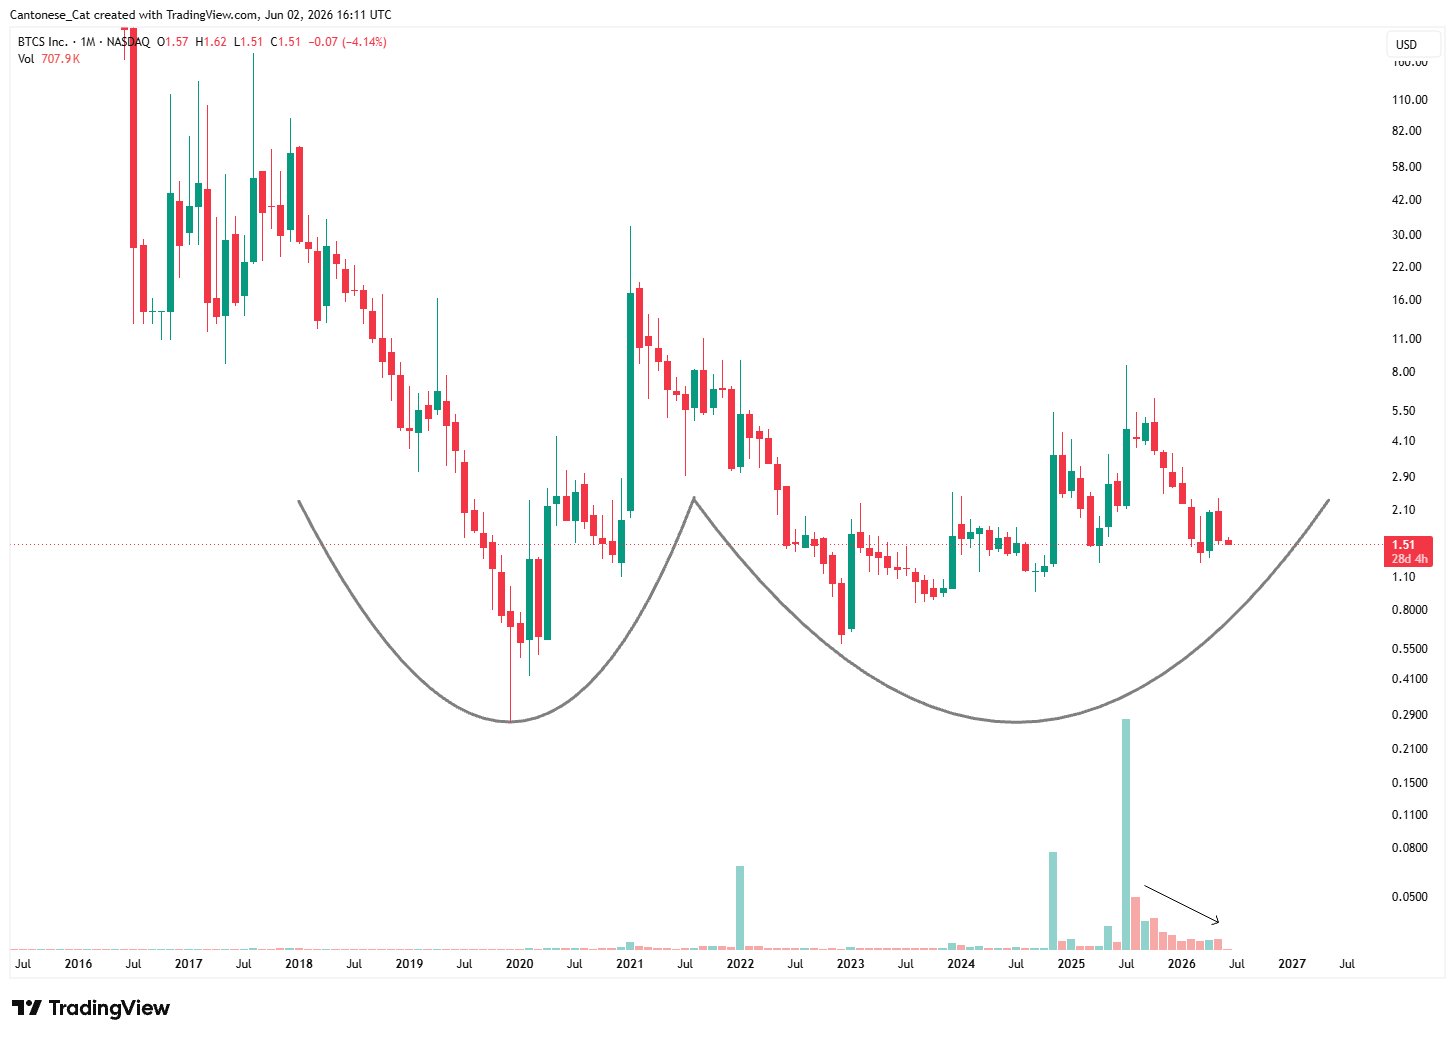
87.5K @cantonmeow $BTCS monthly https://t.co/E92snWn1Zp
 88
13
10.1K
88
13
10.1K