口座開設
QRコードでアプリをダウンロードする
iOS & Android

[Fake]COINBASE (COIN)

$
--
0%
24H

[Fake]COINBASE COIN 価格履歴 USD

[Fake]COINBASEの今日、7日間、30日間、90日間の価格を追跡
期間
24H変動幅
24H変動率 (%)
本日
--
--
7日
--
--
30日
$ 0
0.00%
90日
$ 58.39
-89.99%

COINを今すぐ所有

BitMartでCOINを簡単に安全に売買できます。
今すぐCOINを購入/売却
今すぐ{0}を購入/売却
[Fake]COINBASE 相場情報
$ 1.52 24H変動幅 $ 423.36
過去最高値
‎$ 423.36‎
過去最安値
‎$ 1.52‎
24H変動幅
‎‎
24H取引高
‎0‎
供給量
0.00 COIN
時価総額
‎0‎
最大供給量
270.00M COIN
完全希薄化後時価総額
‎0‎
取引 COIN

稼ぐ

眠っている暗号資産を活用し、セービングやステーキングで安定収益を獲得。
今すぐ試す
今すぐ試す

[Fake]COINBASE Xインサイト

avatar
COIN stock price is approaching the end of the descending triangle, facing a directional choice.

$COIN #COIN Nearing the apex of the descending triangle. https://t.co/nbsGtr0H2D

view 119
view 16
view 30.1K
2026-07-12 22:57
リリース後のCOINのトレンド
弱気
COIN stock price is approaching the end of the descending triangle, facing a directional choice.
avatar
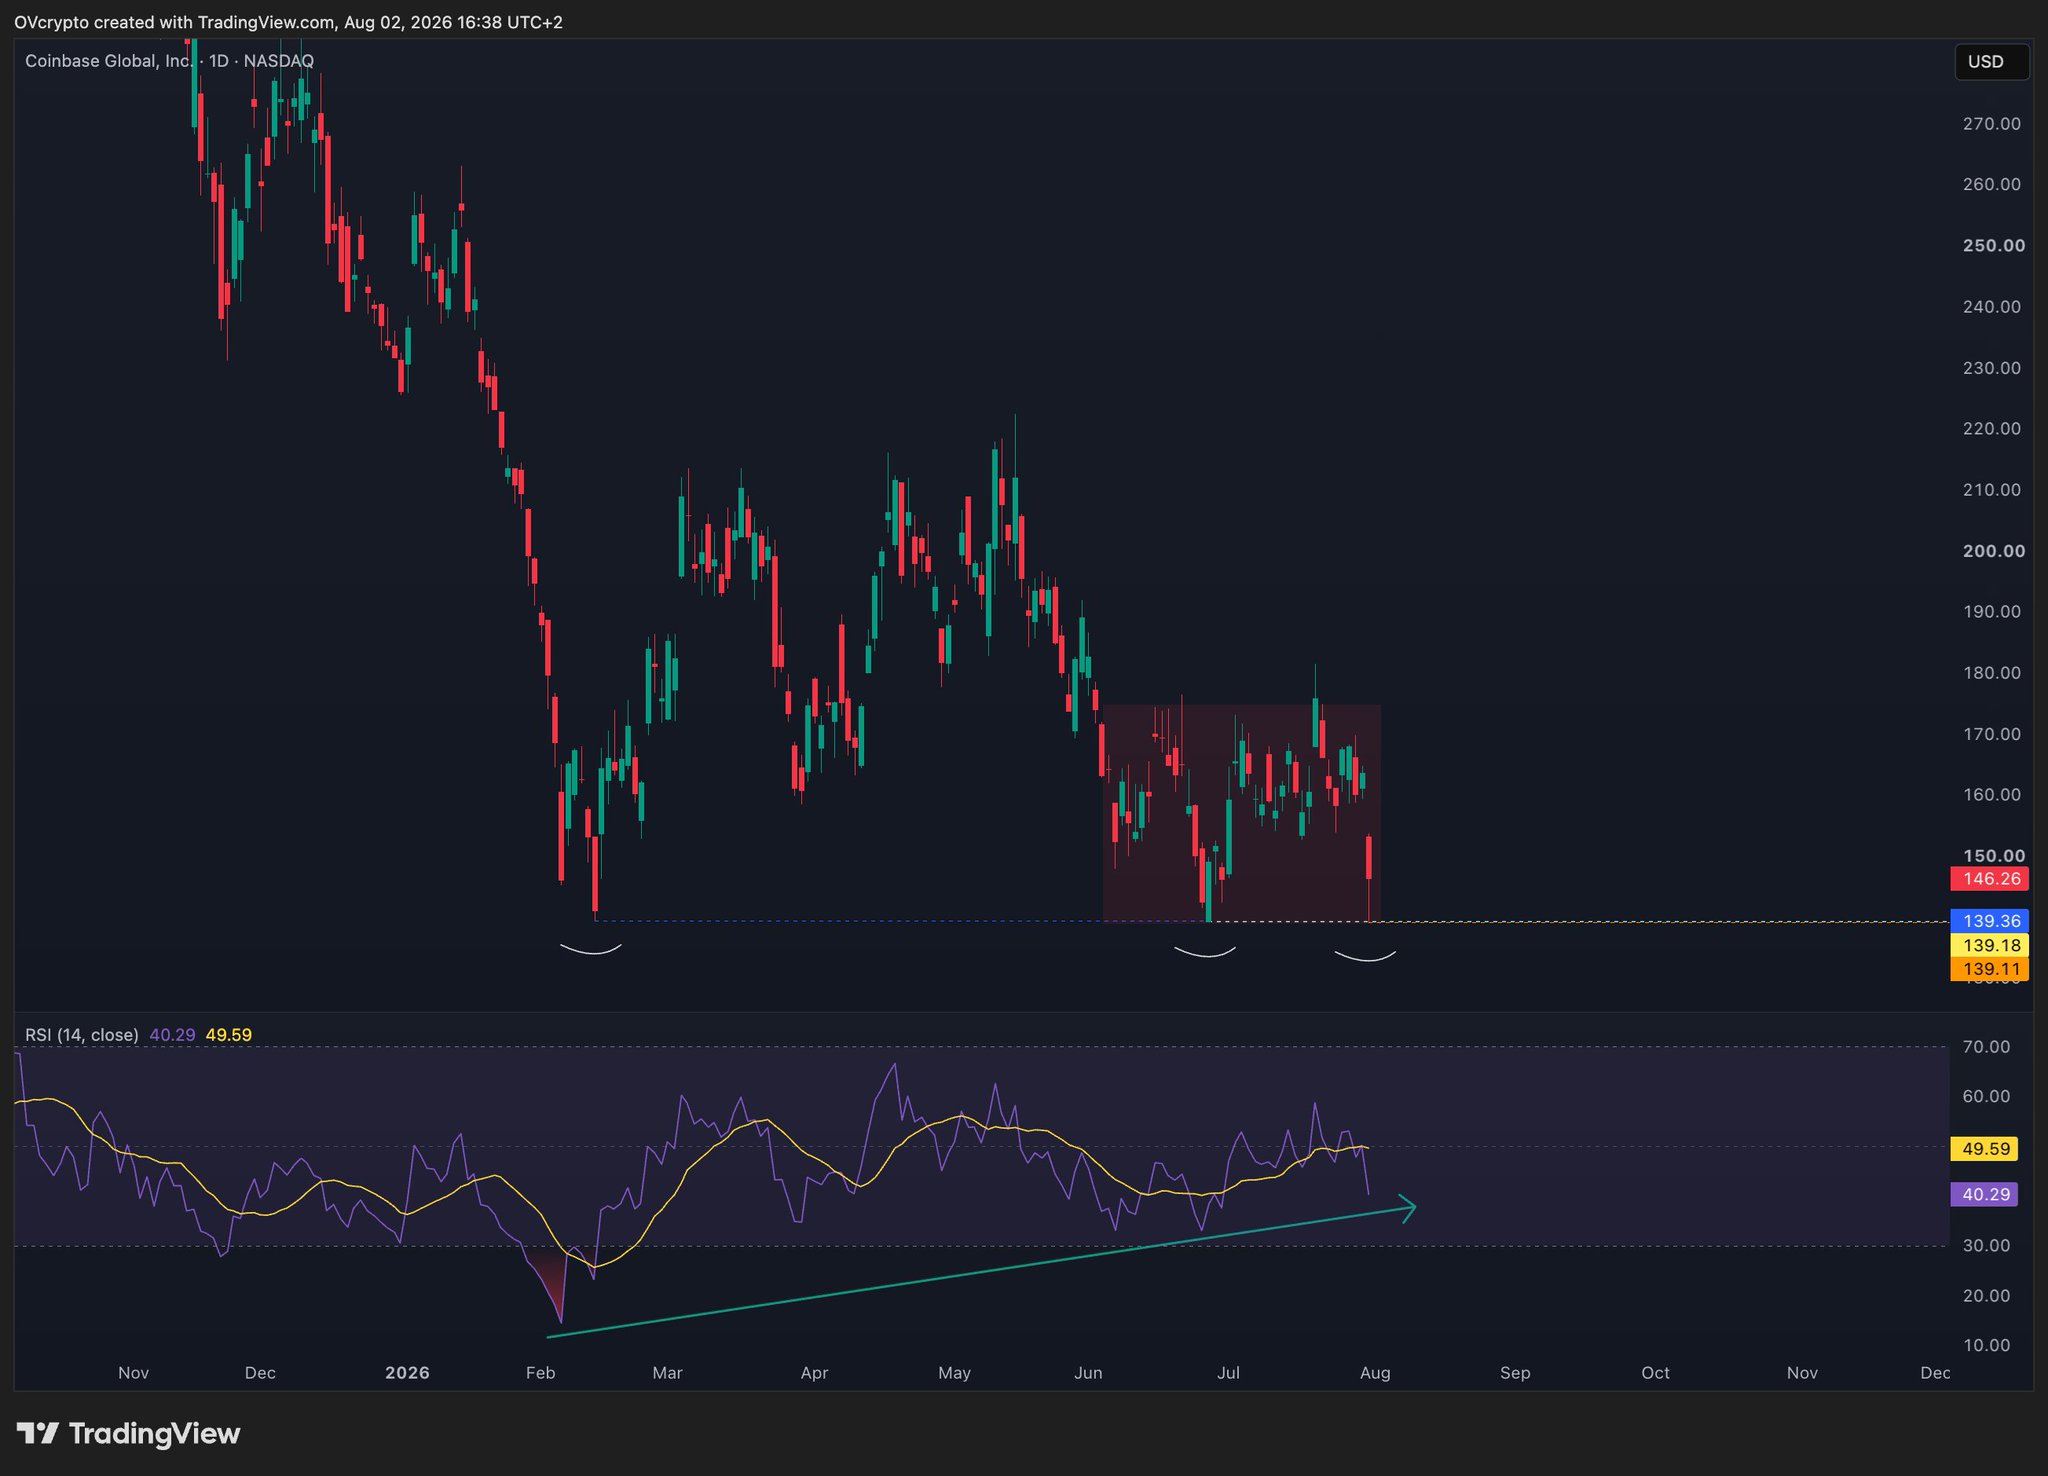
Coinbase is testing a key support level; if it holds, a short-term rebound to $176-$202 is possible.

$COIN
Coinbase is currently testing the important micro-support zone after the expected pullback of the B wave has been completed. The current range could provide the foundation for further short-term recovery.
Leading scenario: The preferred assessment remains that Coinbase is completing a B wave within a larger ABC recovery. As long as the support zone of 145,50–159,20 $ holds, a further rise towards the resistance range of 176,55–202 $ is possible. Risk scenario: Should the support fail, the market could retest the lows from June and February around 138 $ before falling further towards the next Fibonacci support at 118 $. A breakout above 202 $ with a clear 5-wave impulse would instead strengthen the more bullish alternative.
Key support levels: 145,50–159,20 $ / 138 $ / 118 $ Key resistance levels: 176,55–202 $
Conclusion: Coinbase is in a critical decision zone. A bullish reaction at the support would favor another recovery phase, while a break of the support would increase the probability of further downside movement.

view 11
view 1
view 1.9K
2026-07-12 10:12
リリース後のCOINのトレンド
強気
Coinbase is testing a key support level; if it holds, a short-term rebound to $176-$202 is possible.
avatar
COIN consolidates after finding support at $140, watch for a $210 breakout to start a new rally.

$COIN Weekly Gann Square

Consolidating inside the Gann arc after finding support at the horizontal + Gann arc confluence around $140 a few weeks earlier

$180 (upper bound of the Gann arc) and $210 are the critical levels to the upside. A break of $210 would likely signal that the bottoming process has completed and a renewed uptrend can begin.

The Meridian FORCE indicator is still bearish, but has flashed a momentum shift signal recently. Will watch closely for FORCE to turn bullish again.

view 45
view 6
view 4.0K
2026-07-11 20:57
リリース後のCOINのトレンド
強気
COIN consolidates after finding support at $140, watch for a $210 breakout to start a new rally.
詳細確認

価格予測

COINを購入するのに良い時期はいつですか?COINは今買いでしょうか、売りでしょうか?

[Fake]COINBASE(COIN)を購入または売却する適切な時期を決定する際は、まずご自身の取引戦略とリスクプロファイルに合わせることが重要です。長期投資家と短期トレーダーは市場状況を異なる方法で解釈することが多いため、決定には個人的なアプローチを反映すべきです。 最新の COIN 4時間テクニカル分析によると、現在の取引シグナルは ホールド です。 最新のCOIN1日テクニカル分析によると、現在のシグナルは売却です。
59
ホールド
COINの4時間テクニカル分析
最終更新 2026-06-15 15:59:59
38
売却
COINの1日間テクニカル分析
最終更新 2026-06-15 23:59:59
beacon

ビーコン予測

の確率的価格予測(今後24時間)
i
ビーコン予測に関する免責事項
このページに表示されるデータ結果は、選択した取引ペアの実際の取引データ(OHLCV)と対応するテクニカル指標に基づいて分析されています。
この予測は実験的な技術的成果であり、あくまで参考目的で提供しています。これは投資アドバイスをではありません。現実世界での予期せぬ出来事が市場行動に大きな影響を与える可能性があります。トレーダーは慎重に意思決定を行うべきです。
アプリバージョン [Fake]COINBASE
[Fake]COINBASE (COIN) is a cryptocurrency launched in 2025and operates on the Base platform. [Fake]COINBASE has a current supply of 270,000,000 with 0 in circulation. The last known price of [Fake]COINBASE is 6.50267137 USD and is up 0.00 over the last 24 hours. More information can be found at https://linktr.ee/coinbasecoin.
続きを読む