

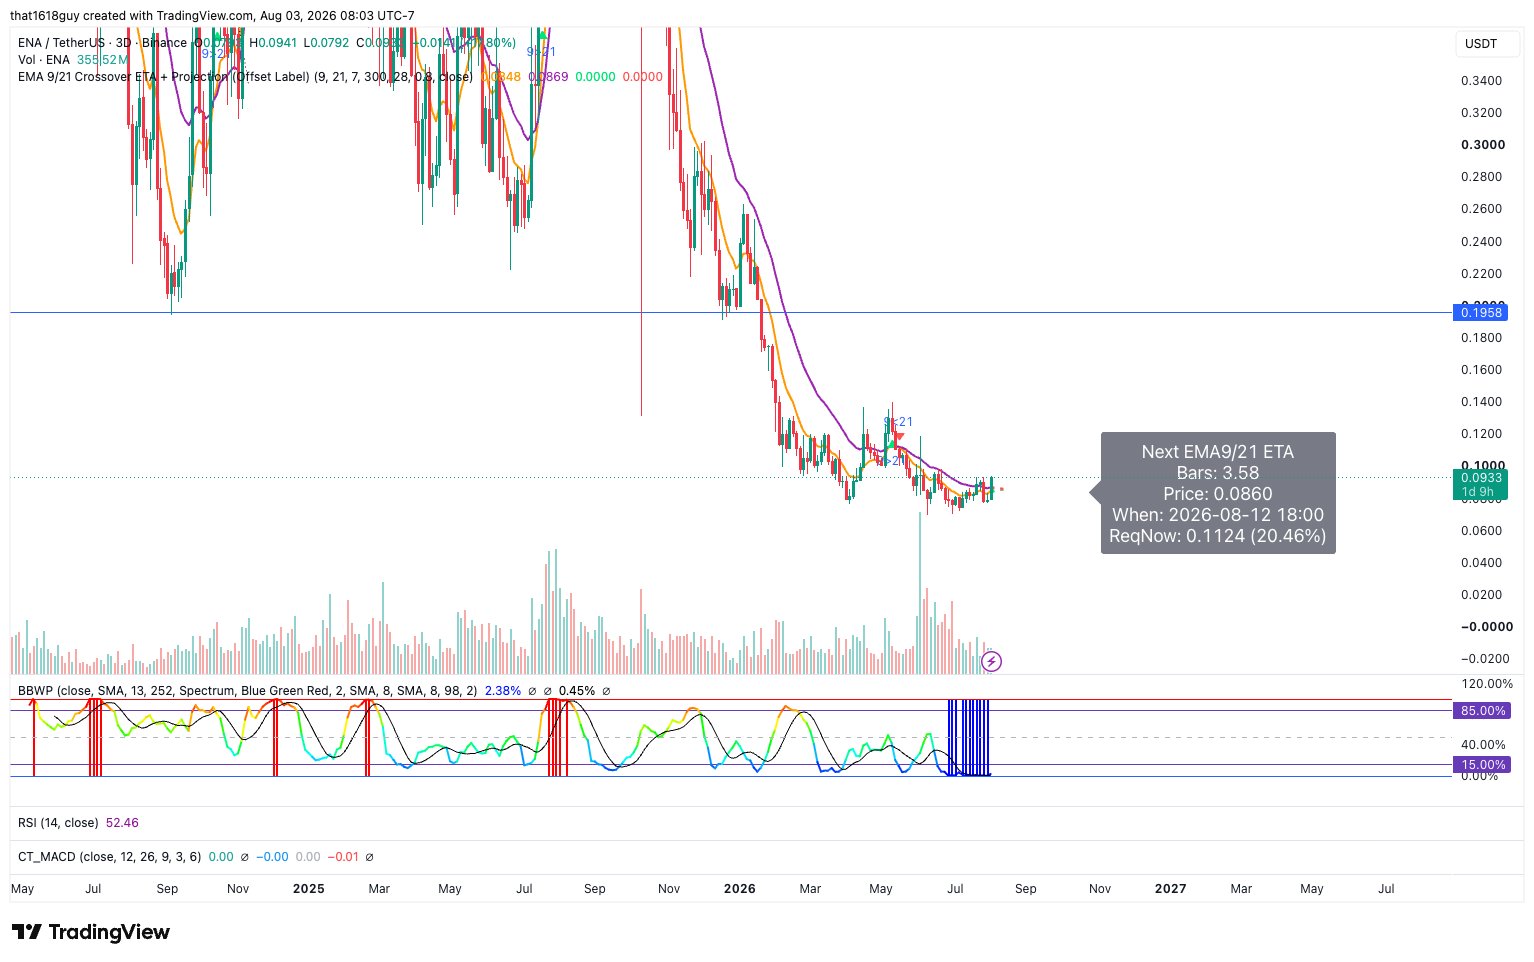
$ENA 3D volatility at historical lows + 9/21 cross otw in ~1 week above 0.086 https://t.co/uOsuqYjPFd


 6.6K @that1618guy
 $ENA 3D volatility at historical lows + 9/21 cross otw in ~1 week above 0.086 https://t.co/uOsuqYjPFd
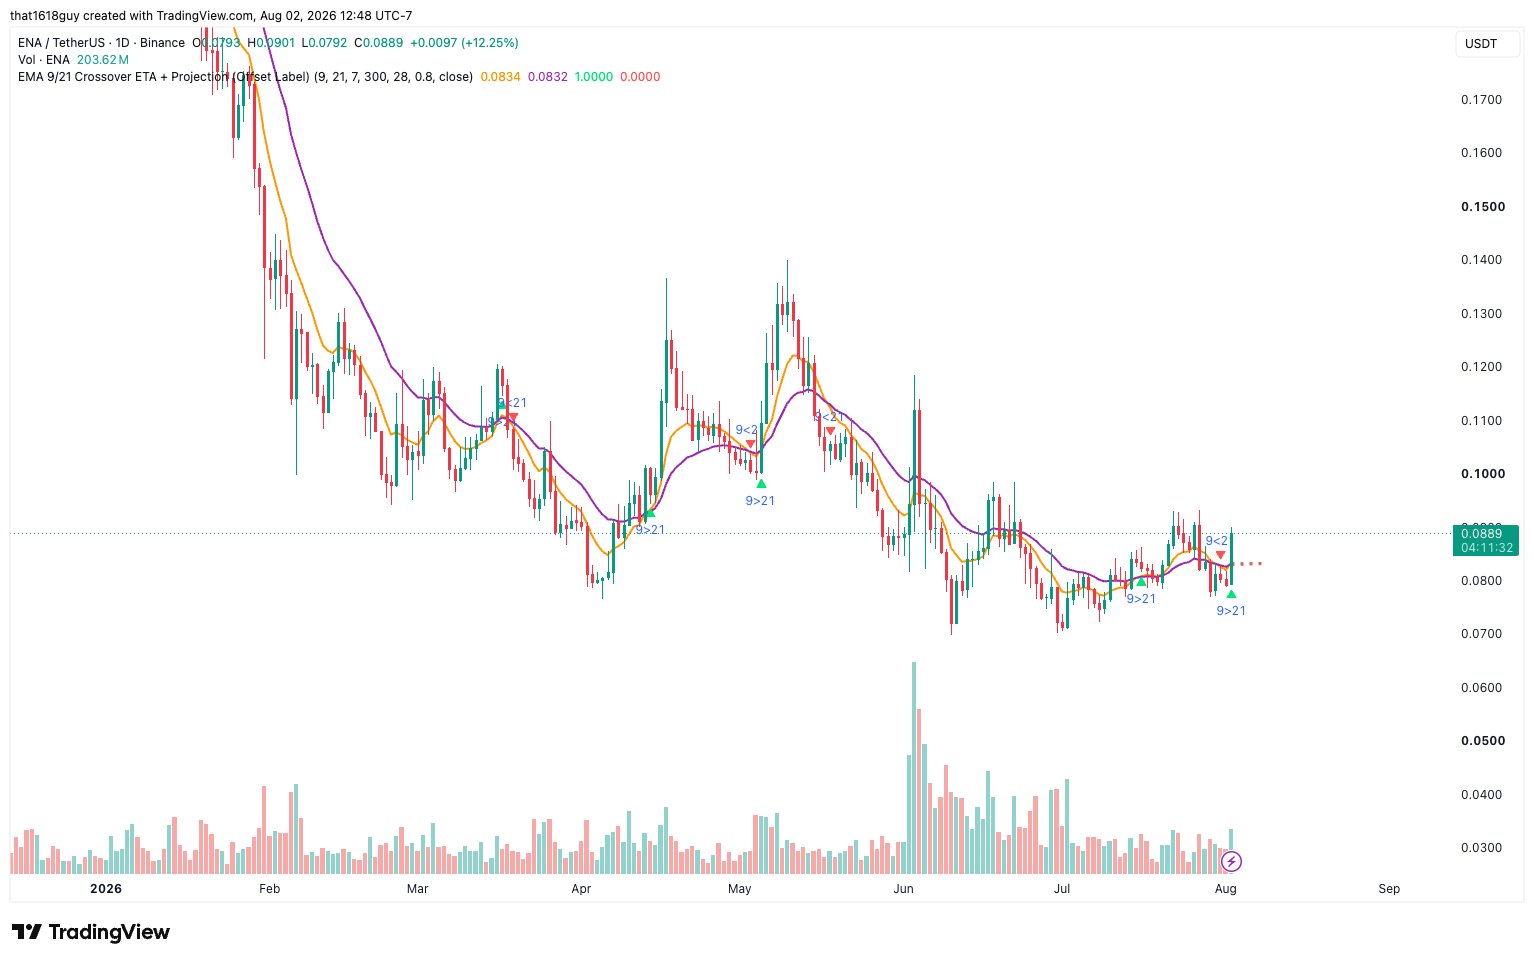
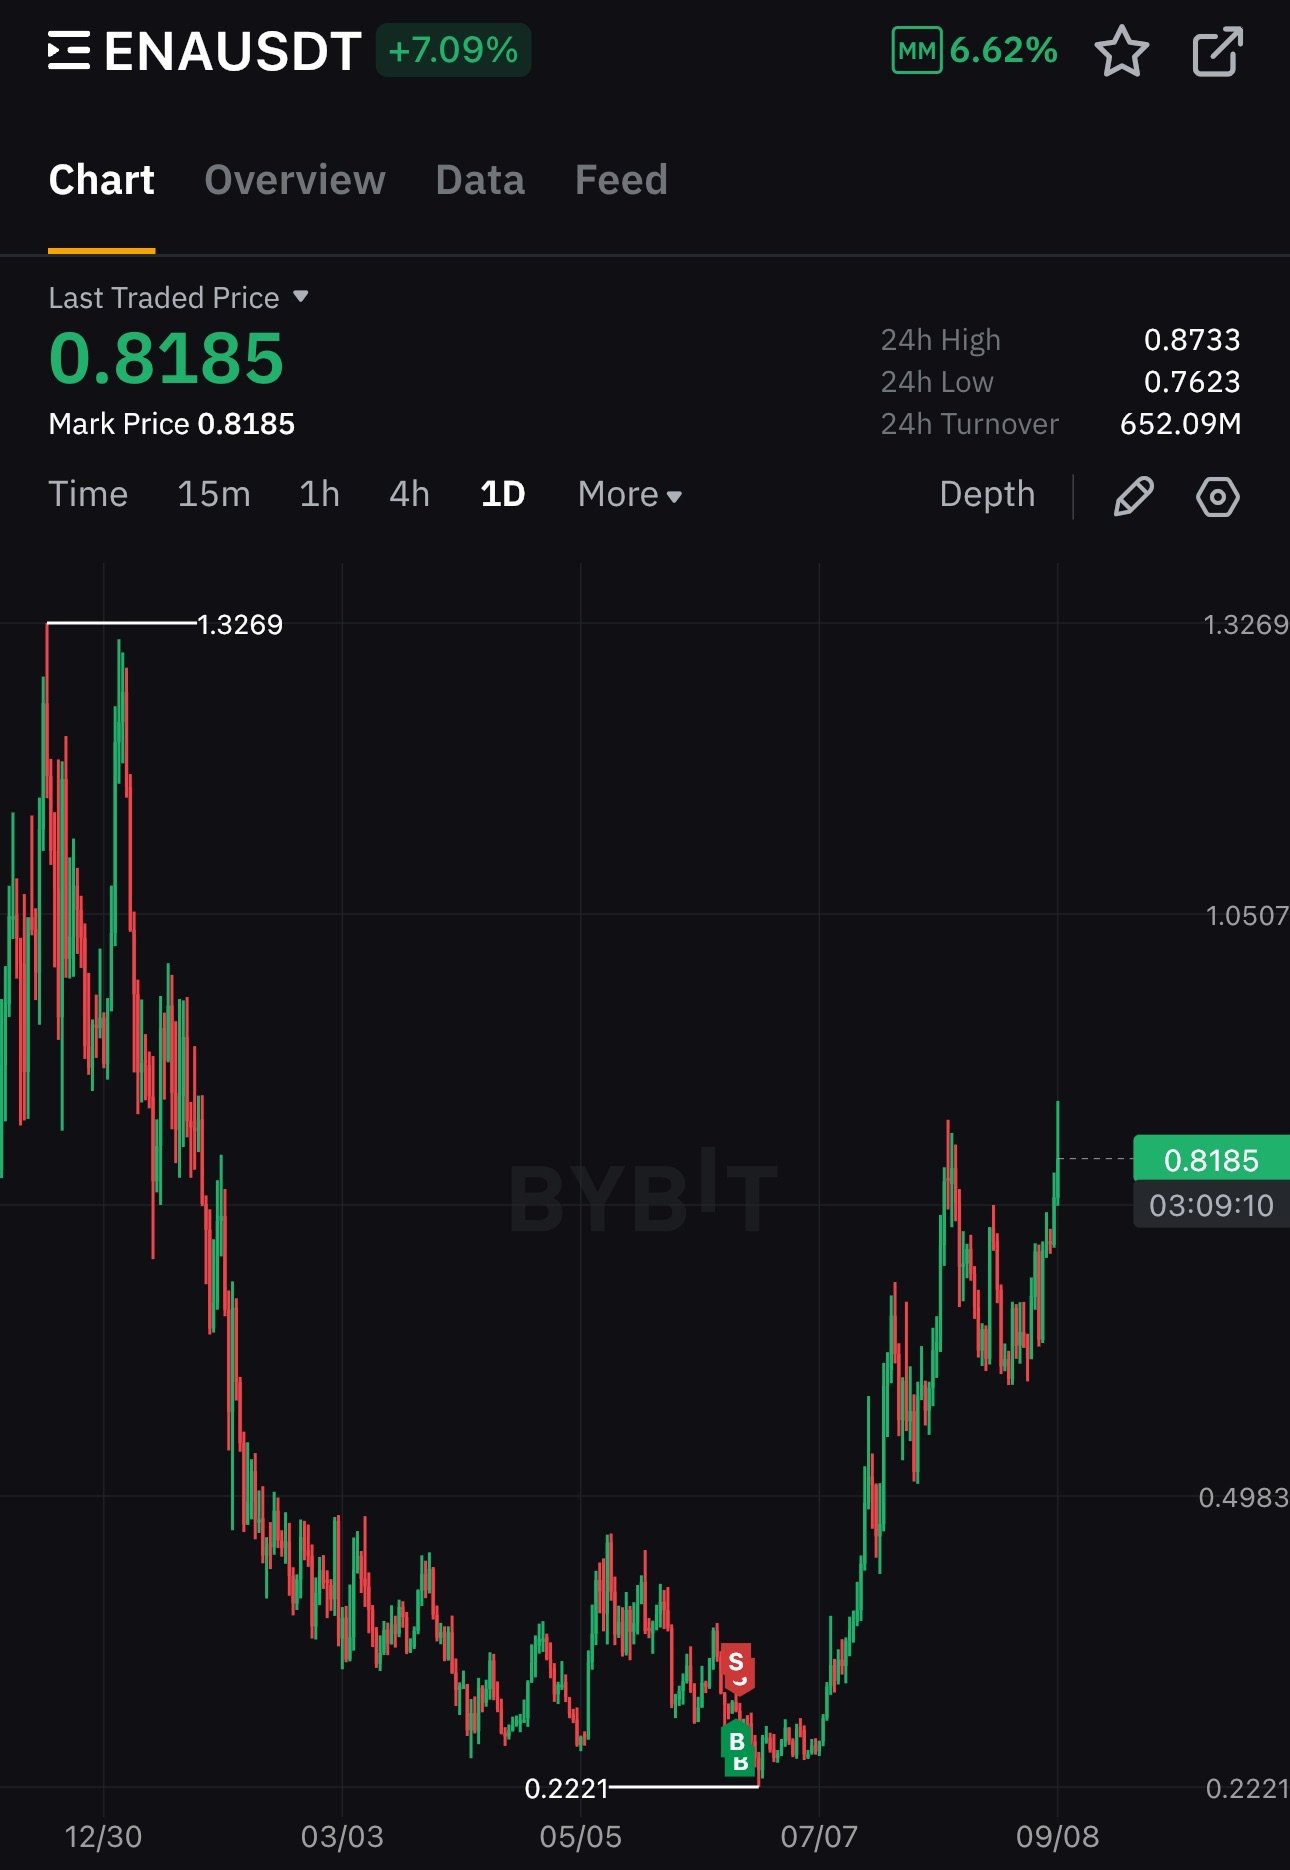
6.6K @that1618guy $ENA - one of those charts where you'd think you have time to accumulate the lows and then BOOM
next thing you're sidelined. happened to me last run up where i literally got shaken out of the lows and then watched it rip a 4x
idk if lows are in but getting similar vibes https://t.co/EFhiUQa8dC
 3
3
 2
2
 684
684
 819.3K @CryptoMichNL
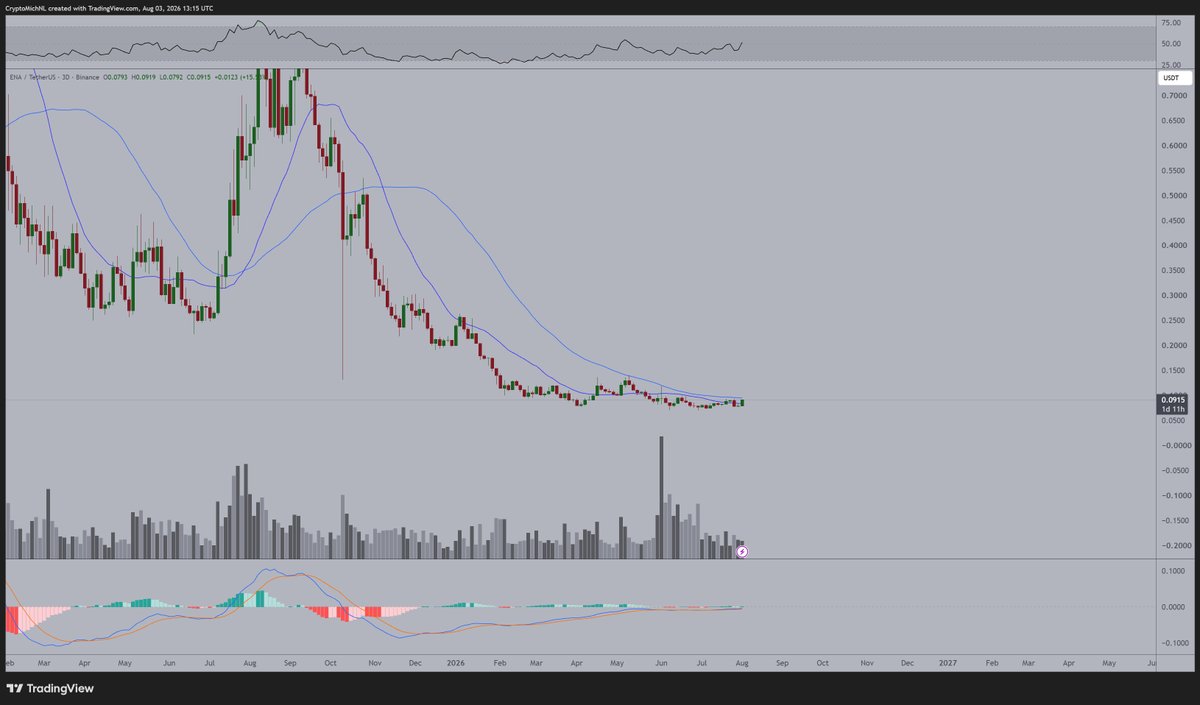
 I can see why @CryptoHayes has bought some more $ENA.
After a long period of boredom and bear market, it's finally starting to break out of a downtrend.
➡️ - One year long bear market about to break.
➡️ - Higher timeframe MA's ready to flip for support.
➡️ - Strong bullish divergences on multiple timeframes indicating that there's a change coming up.
➡️ - Volume has increased.
I wouldn't be surprised if this one goes 3-4X in the coming period.
 36
21
15.0K
36
21
15.0K
 69.7K @CryptoPatel
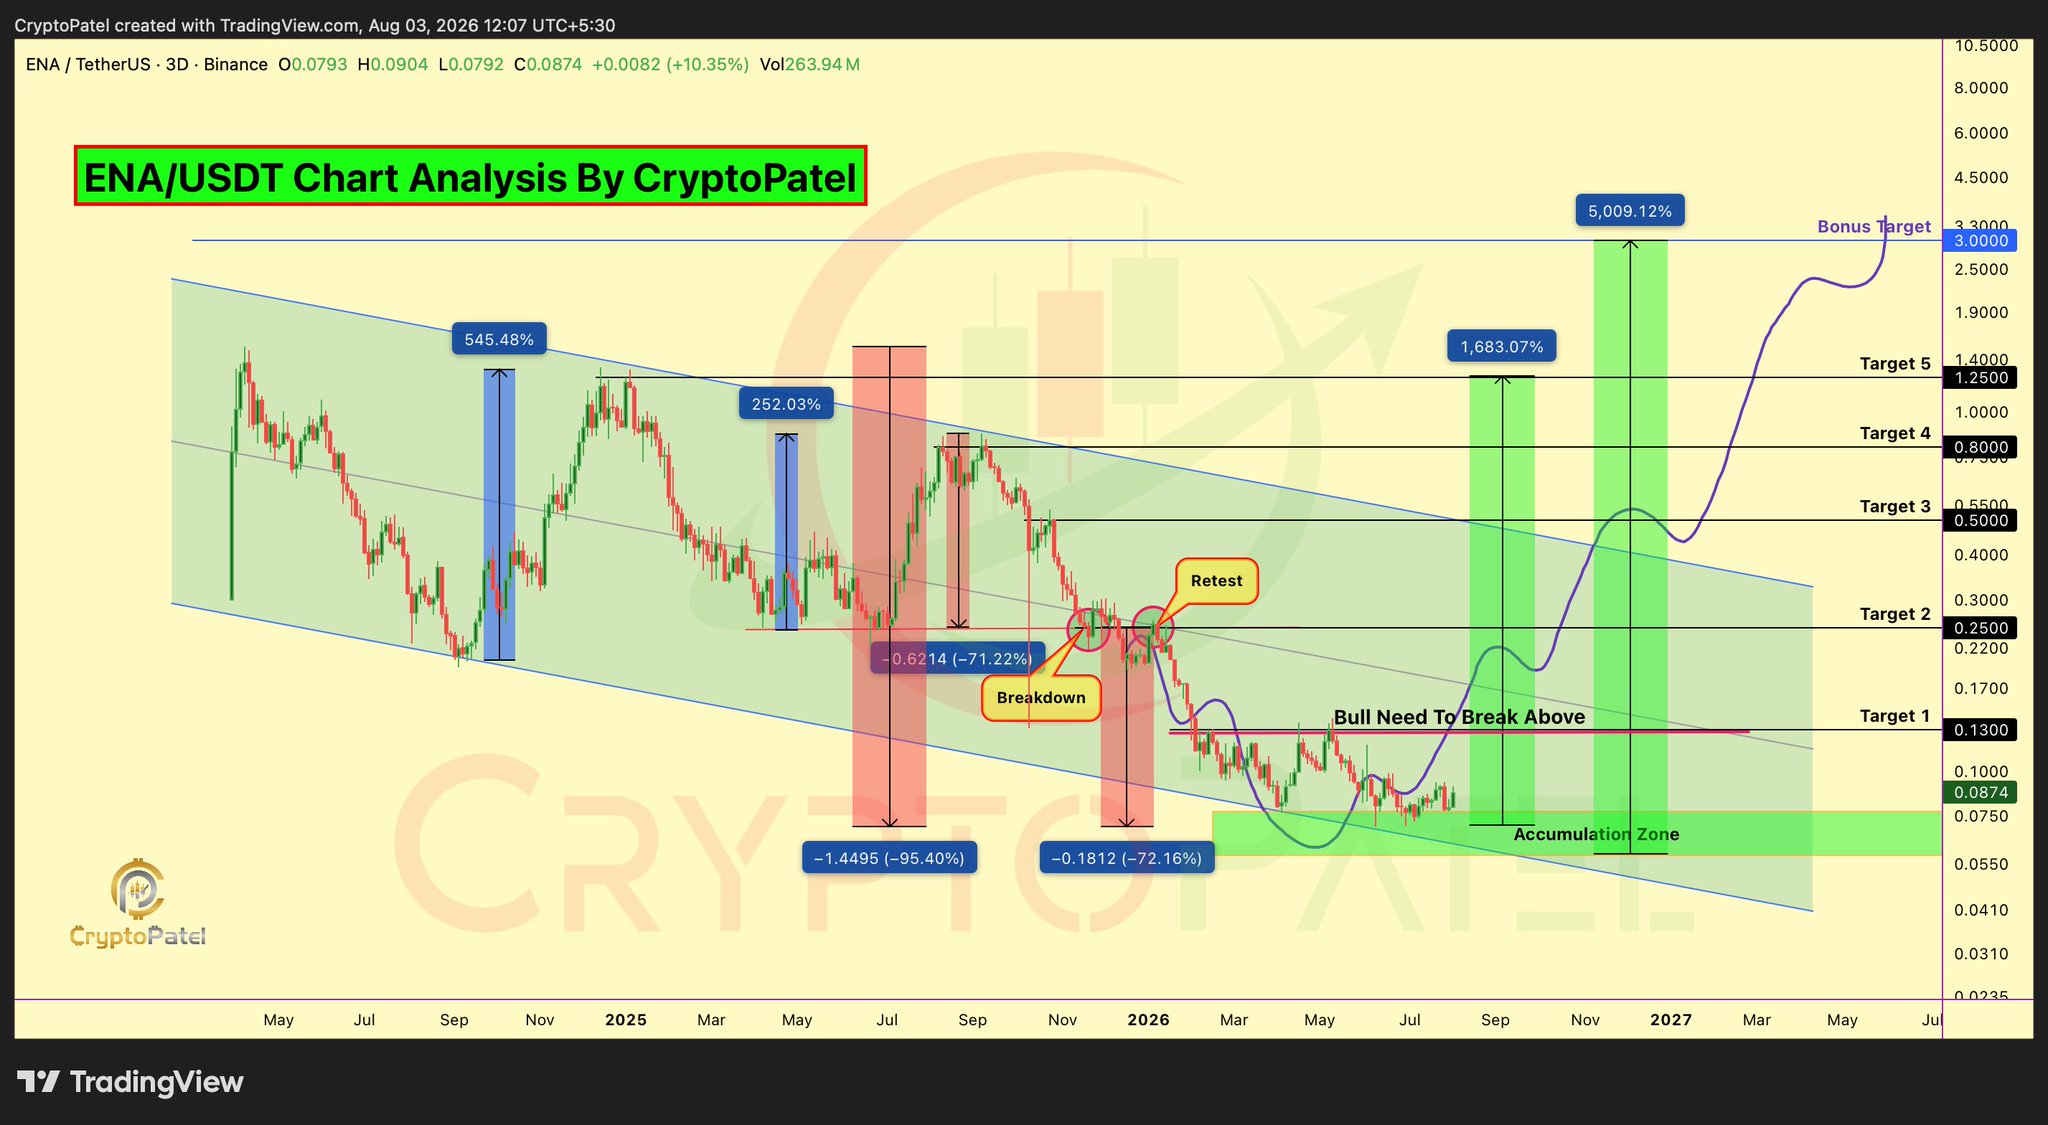
 Everyone Is Ignoring $ENA At Cycle Lows. The Next HTF Breakout Could Open A 10x–50x Expansion
#ENA Has Completed A Full -95% Bear Market Cycle Inside A Multi-Year Descending Channel. After Breakdown Below $0.25 And A Perfect Bearish Retest, Price Is Now Building A HTF Accumulation Base Inside A Major Demand Zone. The Trend Remains Neutral Until $0.13 Breaks, But The Risk/Reward Profile Is Becoming
Technical Structure
✅ Full Macro Correction: -95% From Cycle High
✅ Two Distribution Legs: -72% & -72% Fully Completed
✅ Breakdown & Bearish Retest Below $0.25 Confirmed Trend Continuation
✅ Multi-Year Descending Channel Still Intact (High Timeframe)
✅ HTF Accumulation Zone: $0.078–$0.058
✅ Current Price Holding Above Demand At $0.078
✅ Key Confirmation Level: $0.13 (Range High + Channel Resistance Confluence)
✅ Bullish Market Structure Shift Only Above $0.13
✅ Major Resistance Ladder: $0.13 → $0.25 → $0.50 → $0.80 → $1.25 → $3
✅ Invalidation: Confirmed 3D Close Below $0.055
➡️ 2024–2026: Multi-Year Descending Channel Controlled The Entire Trend
➡️ Late 2025: $0.25 Support Broke, Retest Failed, Bearish Continuation Confirmed
➡️ Early 2026: Capitulation Completed Inside Major Demand Zone
➡️ Current Phase: Post-Distribution → Institutional Accumulation
Scenario 1 → Bullish Confirmation (Above $0.13):
A High-Volume HTF Close Above $0.13 Would Confirm Both The Range Breakout And Descending Channel Breakout. That Would Mark The First Higher High On The Macro Structure And Open The Path Toward $0.25 → $0.50 → $0.80 → $1.25, With An Extended Bull Cycle Objective Near $3.
Scenario 2 → Accumulation Continues (Below $0.13):
As Long As ENA Holds The $0.058–$0.078 Demand Zone, The Accumulation Thesis Remains Valid. This Is A Position-Building Environment, Not A Momentum-Chasing Environment. A Confirmed 3D Close Below $0.055 Invalidates The Entire Bullish Structure.
Structure Shift Requirements
1️⃣ Strong 3D Close Above $0.13 With Rising Volume
2️⃣ Breakout Above The Multi-Year Descending Channel
3️⃣ Higher High Followed By A Higher Low On HTF
4️⃣ Sustained Acceptance Above $0.25 To Confirm Trend Expansion
Bull Cycle Targets: $0.25 → $0.50 → $0.80 → $1.25 → $3.00
Invalidation: Confirmed 3D Close Below $0.055
Fundamentally, Ethena Continues Expanding Through Strong USDe Adoption, Growing DeFi Integrations, And Increasing Ecosystem Usage. The Main Headwind Remains Ongoing Token Unlocks, Meaning Fundamentals Keep ENA On The Watchlist, But Technical Confirmation Must Trigger Execution.
TA Only. Not Financial Advice. ALWAYS DYOR.
@ethena
 226
26
4.3K
226
26
4.3K
