$NOW
I am watching it this way https://t.co/h6MkzlJc2w
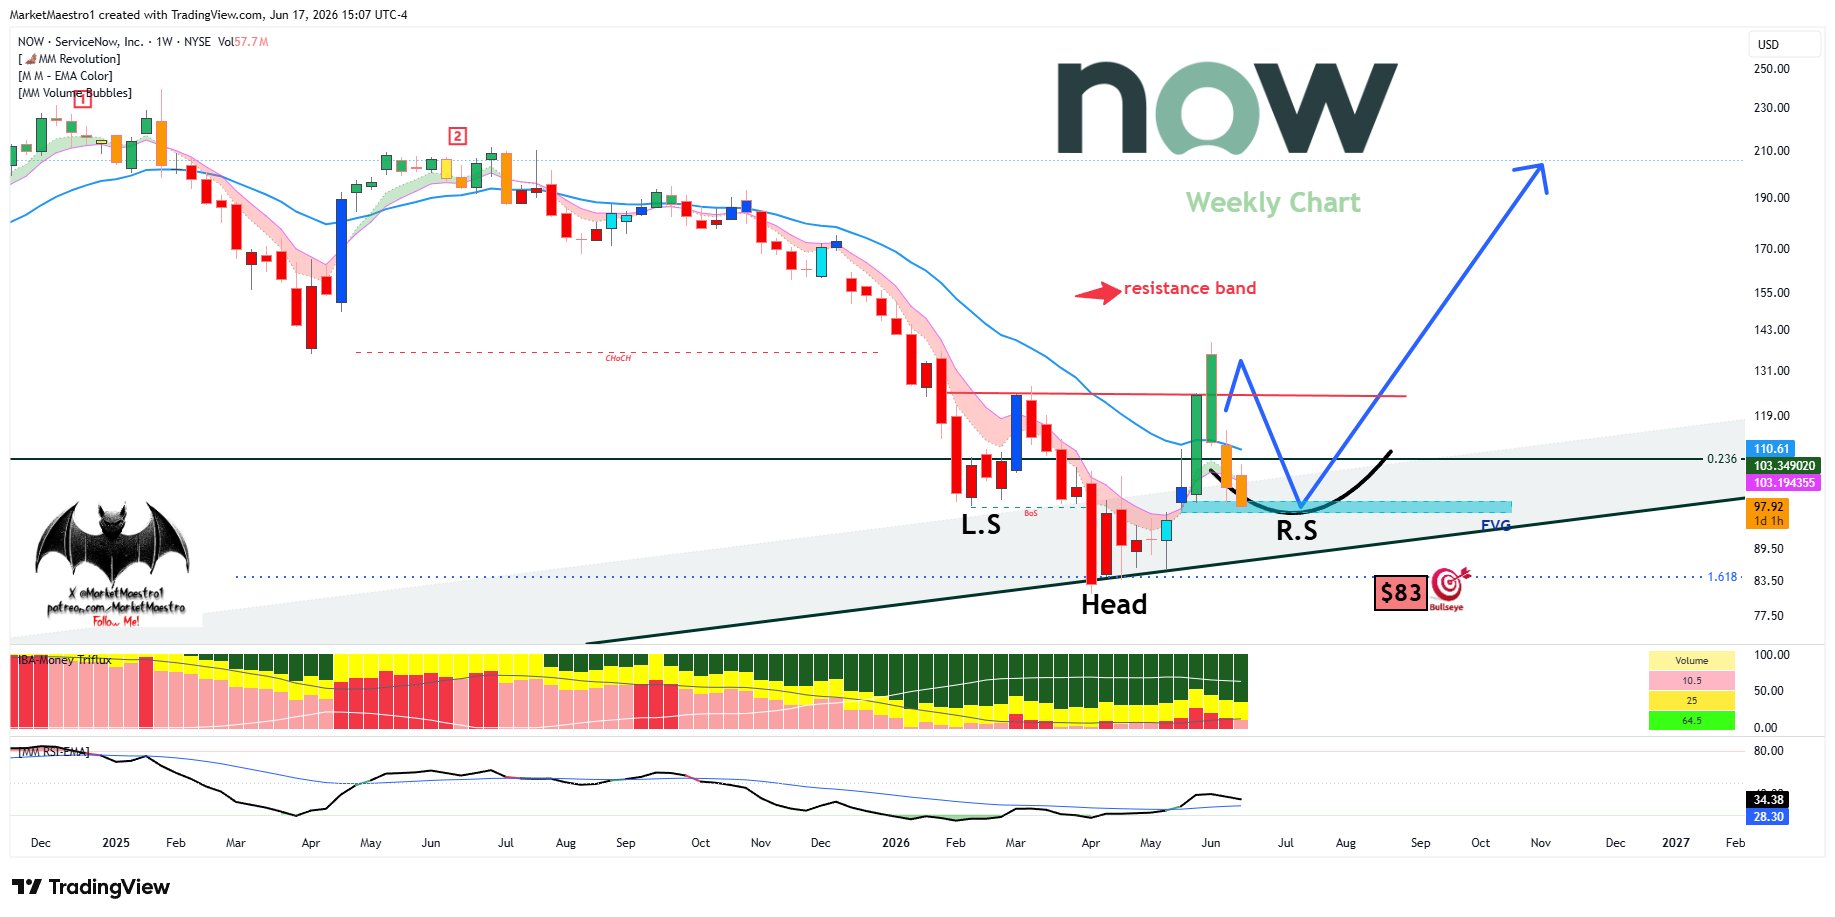


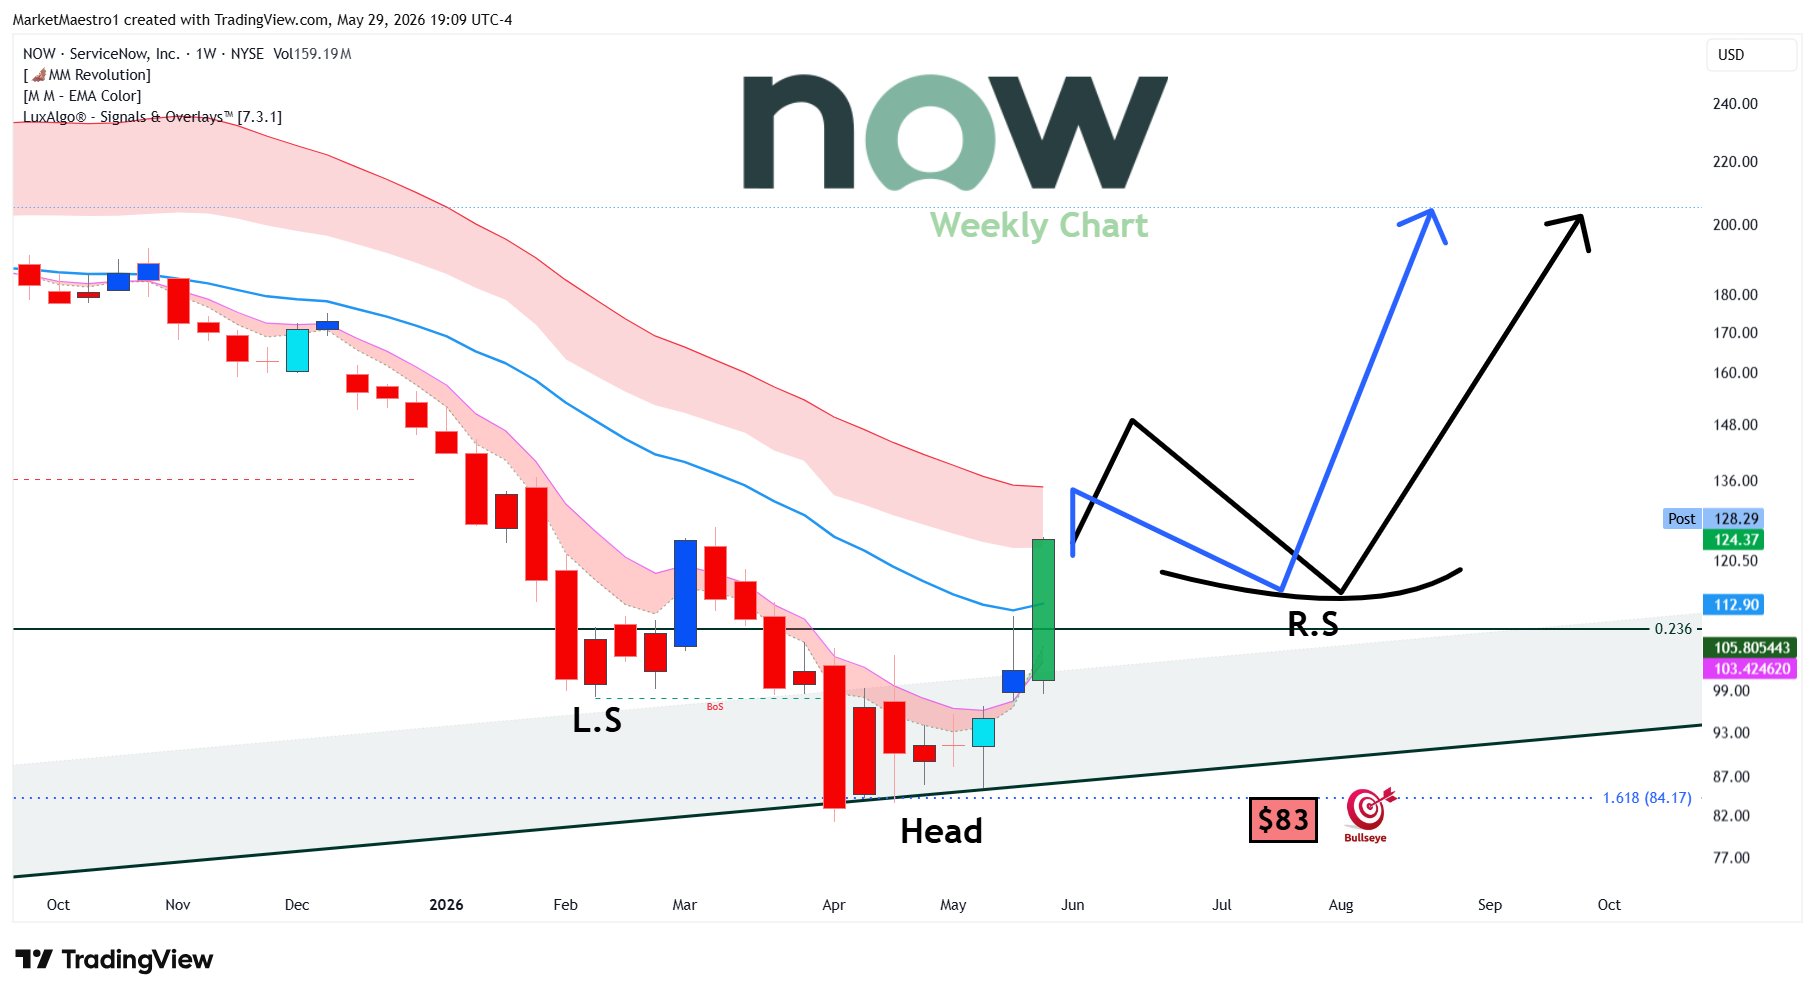
 46.4K @MarketMaestro1
 $NOW
I am watching it this way https://t.co/h6MkzlJc2w
46.4K @MarketMaestro1 $NOW
I see both paths as possible. I think it will need a small right shoulder https://t.co/7CkKTBfyxb
 238
238
 8
8
 36.4K
36.4K
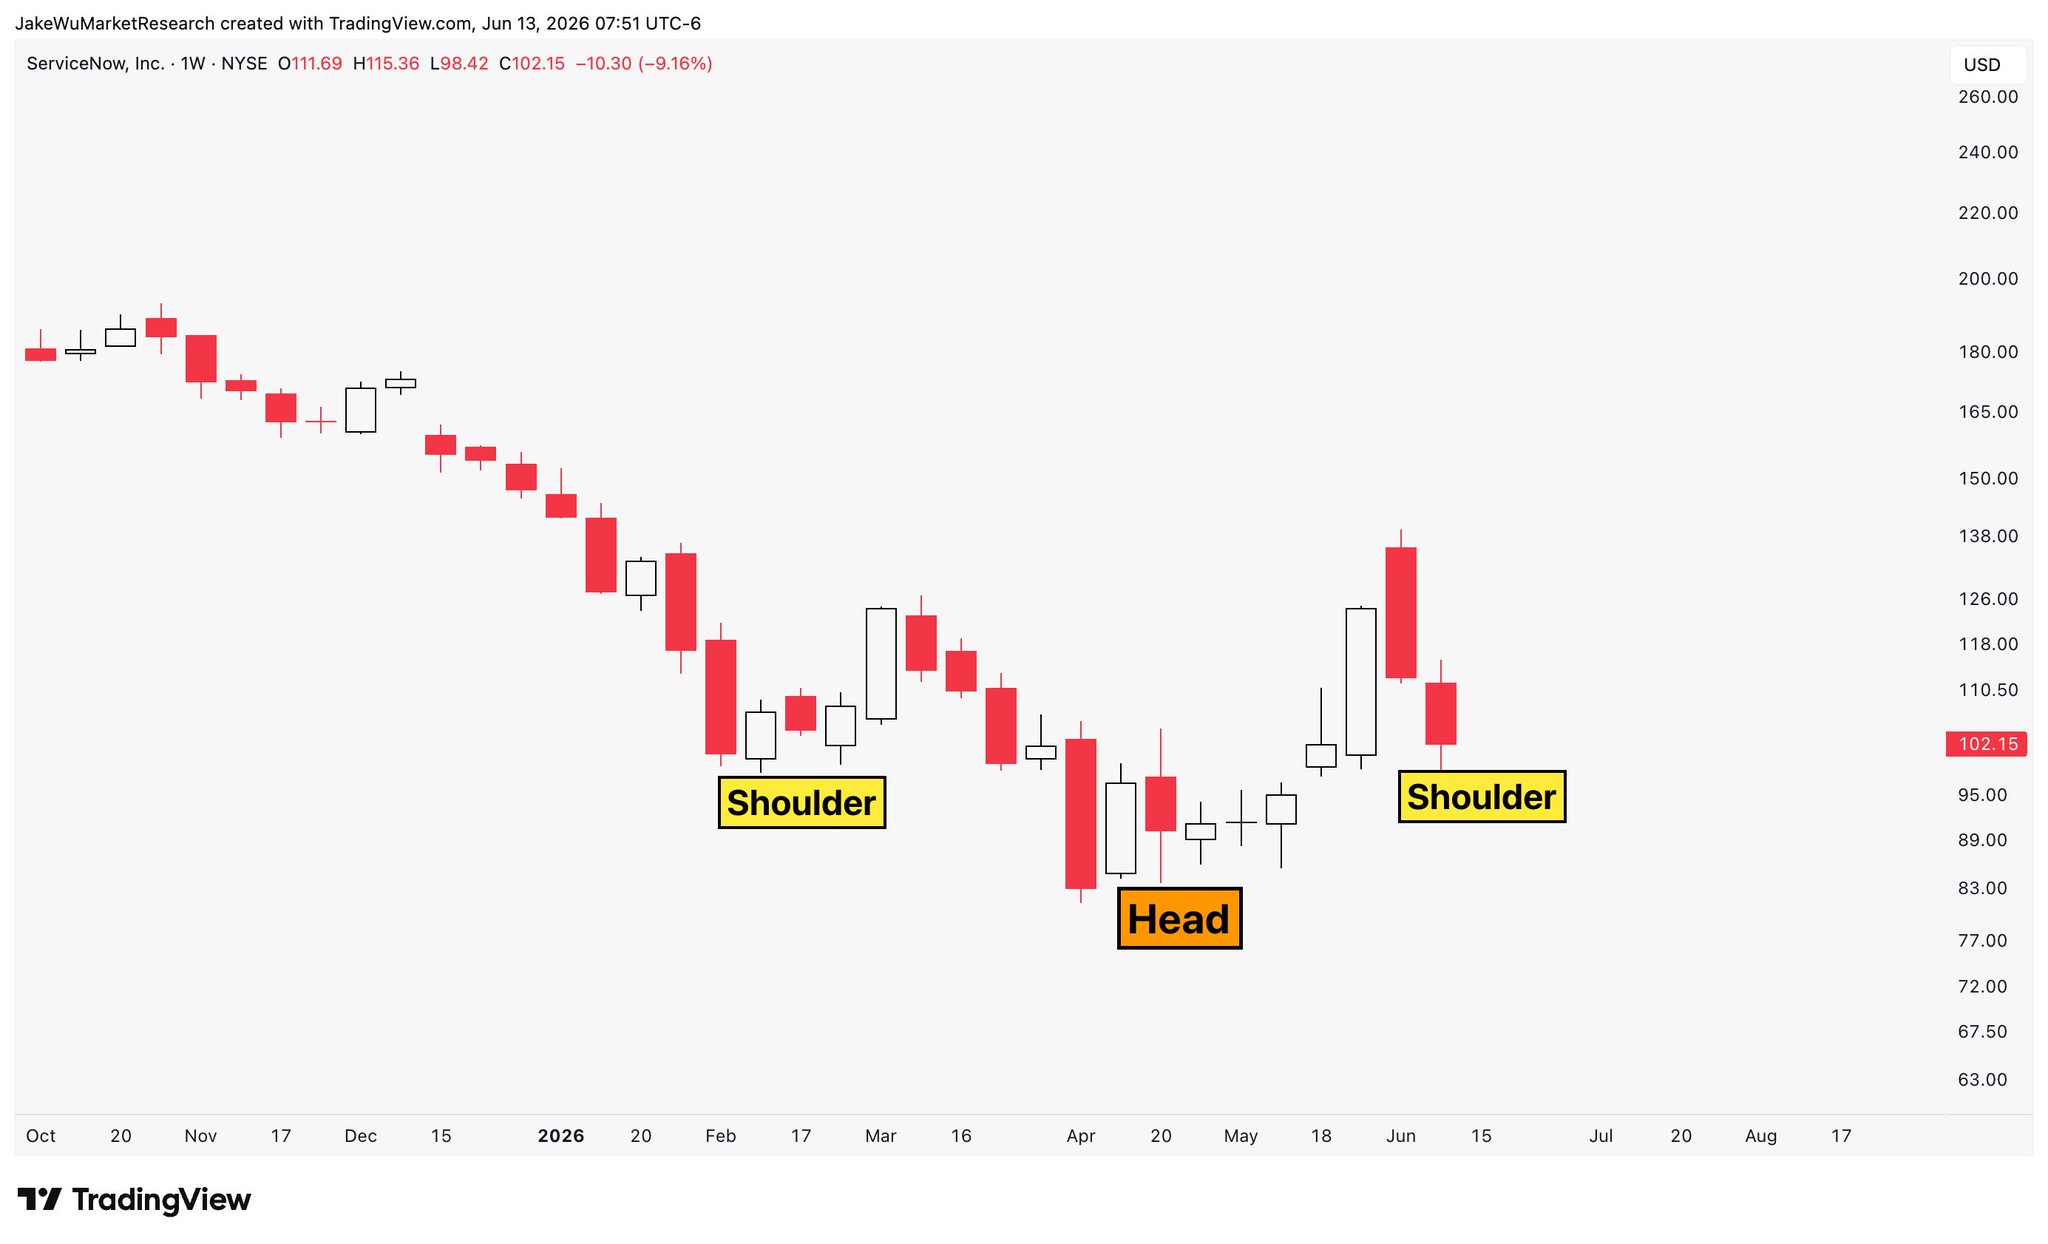
 397.3K @Jake__Wujastyk 397.3K @Jake__Wujastyk
 $NOW #NOW With this being in Trump's portfolio, I don't see it being down here again for much longer. https://t.co/NK7G47IE0G
 487
26
59.8K
487
26
59.8K
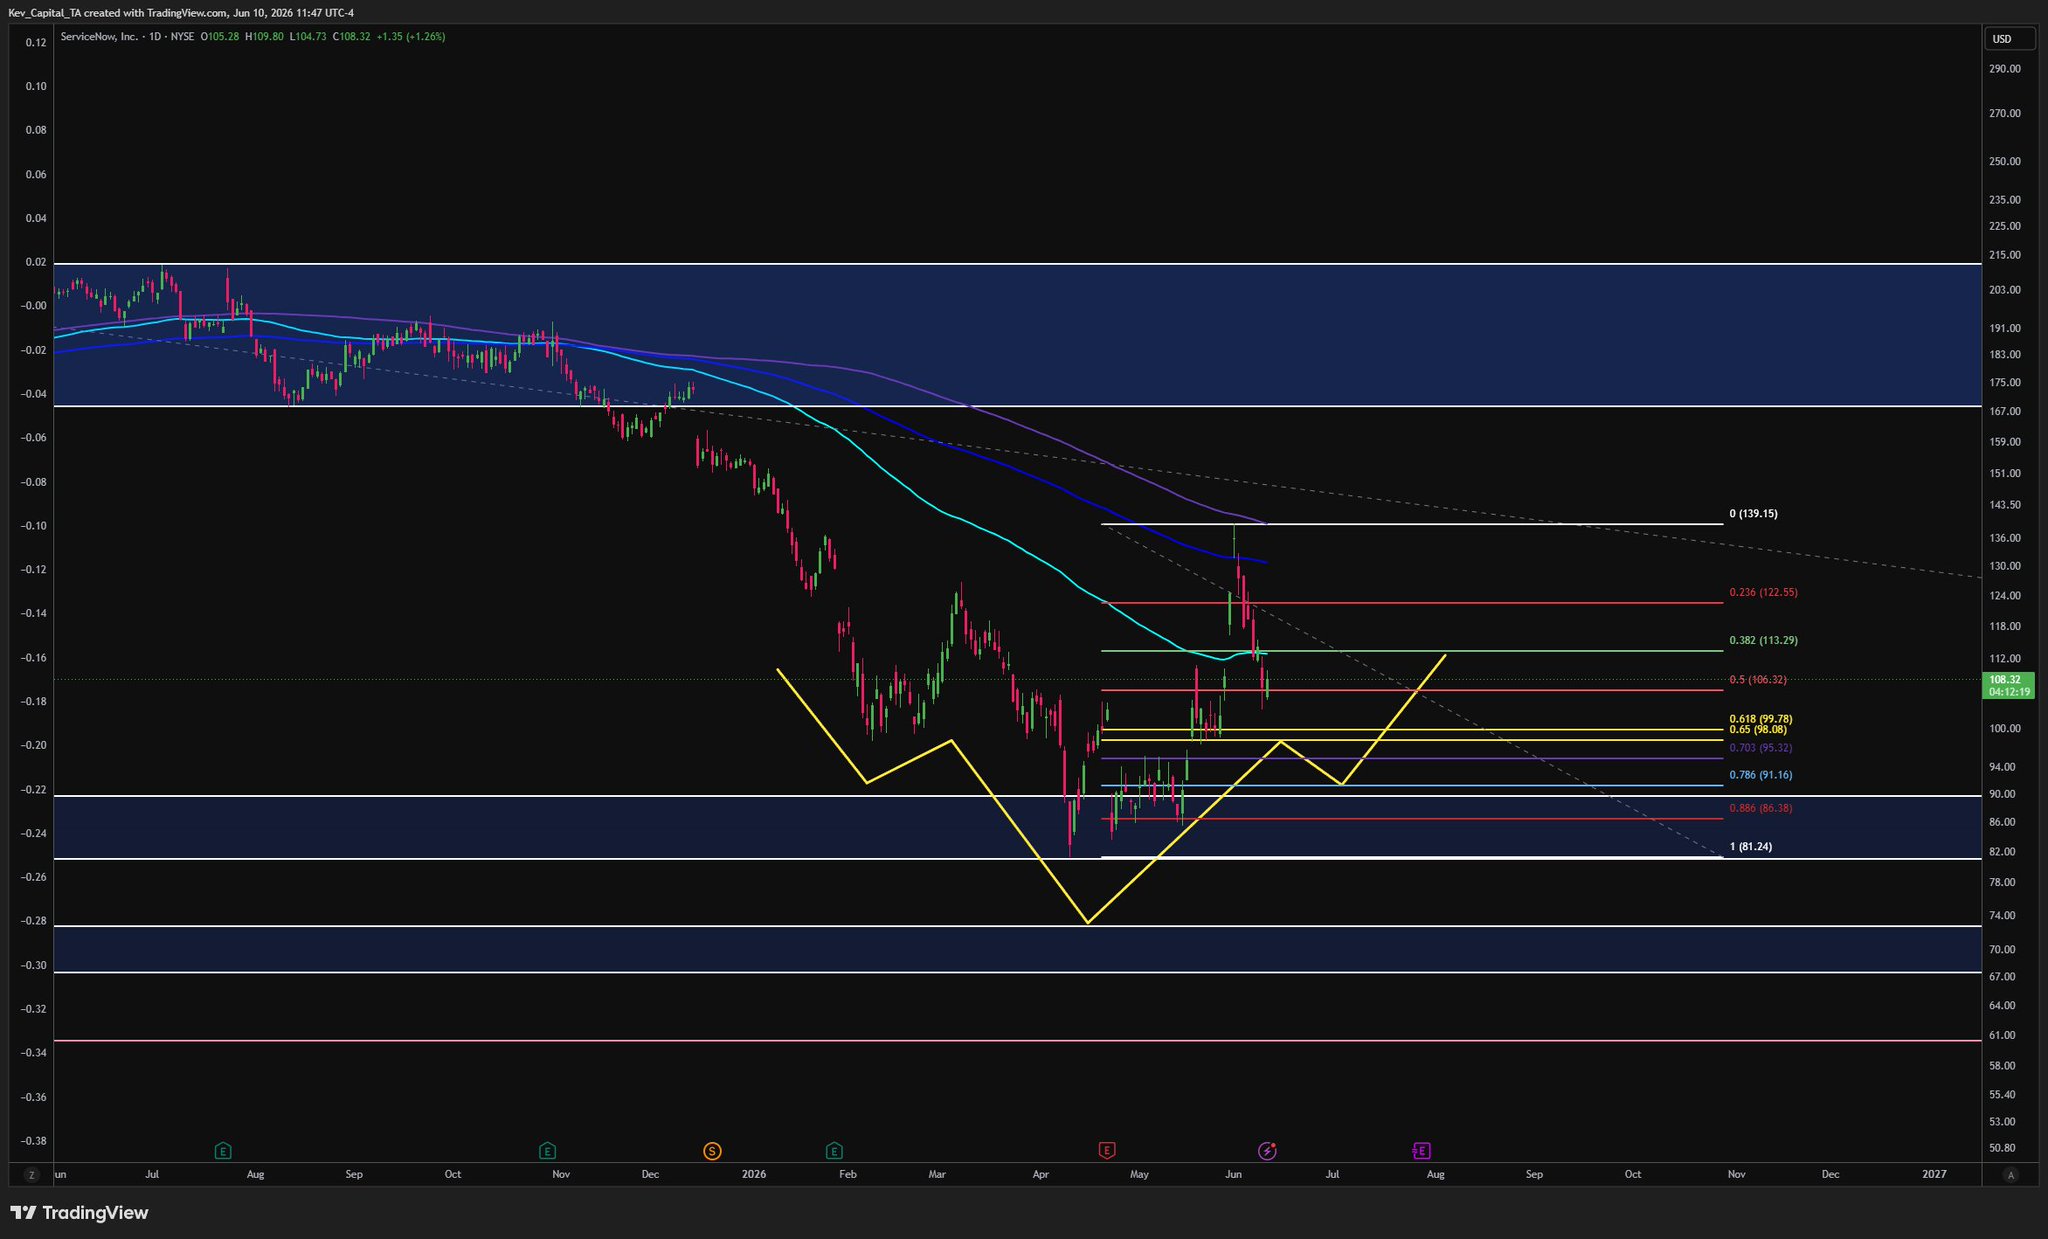
 24.5K @Kev_Capital_TA
 🚨 $NOW investors, listen up!
The stock is continuing to follow my roadmap.
We saw a sharp counter-trend bounce off the lows into resistance ✅
It's holding major moving averages and key Fib levels on the pullback.
Now, it's beginning to form the right shoulder of a larger inverse H&S bottom, perfect during this summer weakness.
A breakout above $200 is on the table, if the pattern and fundamentals align, thats what you need to watch for. 🤝
 28
4
2.2K
28
4
2.2K