Rewards
Futures Daily Draw
100% Chance To Win With Daily Trades
現物の日次のドロー
Win 8,888 USDT In Grand Prizes
ステークして投票
投票してエアドロップを獲得
機関
プロなかつ専門的なサービス対応
BitMart VIP
限定報酬のロック解除
アカデミー
トレードとブロックチェーンについて
BitMart Internship
Start your Crypto Career Here
BitMart Travel
ワンストップグローバルトラベルサービス
モバイルチャージ
モバイルを簡単に、オンラインで、安全にチャージ
Send
Send money globally, fast and secure
BitMartモール
Live on crypto

Render ライブ価格データ
Renderの今日の価格は$ 1.54 (RENDER/USD)です。 時価総額$ 797.85M USD、 24時間取引量$ 1.43M USD、 24時間の価格変動+1.25%、 そして流通供給量518.77M RENDER。
Render RENDER 価格履歴 USD
Renderの今日、7日間、30日間、90日間の価格を追跡
期間
24H変動幅
24H変動率 (%)
本日
$ 0.018
1.25%
7日
$ 0.034
-2.22%
30日
$ 0.62
-29.00%
90日
$ 0.11
-6.84%
RENDERを今すぐ所有
BitMartでRENDERを簡単に安全に売買できます。
Render 相場情報
$ 1.49 24H変動幅 $ 1.57
過去最高値
$ 11.80
過去最安値
$ 0.55
24H変動幅
1.25%
24H取引高
$ 1,425,848.94
供給量
0.51B
RENDER
時価総額
$ 797.85M
最大供給量
0.64B
RENDER
完全希薄化後時価総額
$ 990.71M
取引 RENDER

Render Xインサイト

2xnmore
FA_Analyst
OnChain_Analyst
B
 45.2K @2xnmore
 中立
RENDER/USDT has slipped to the critical support zone of 1.50-1.60, technical indicators are weak, and bottom signals need to be observed.
2xnmore
FA_Analyst
OnChain_Analyst
B
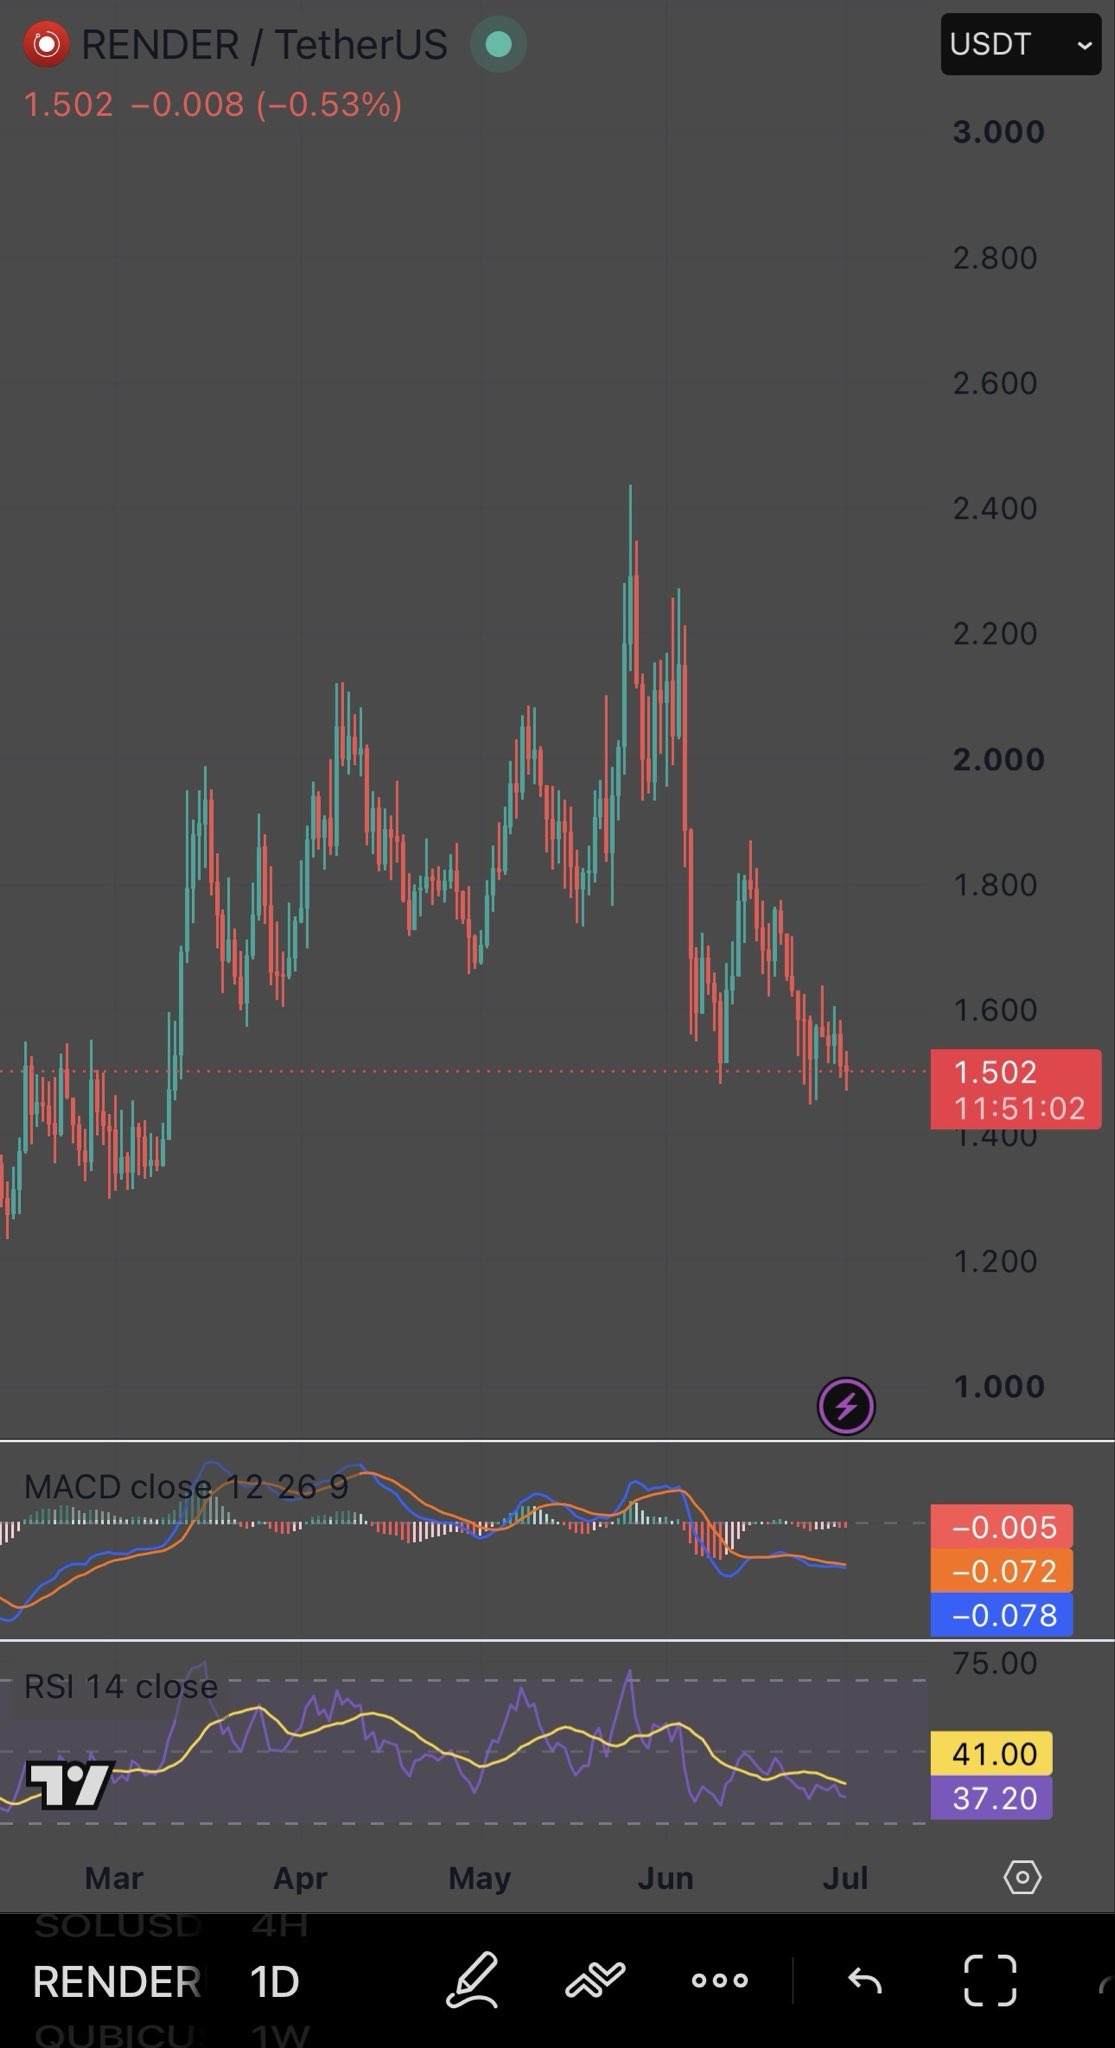
45.2K @2xnmore Everyone celebrated $RENDER hitting 2.40 in June.
Almost nobody noticed the divergence forming underneath it.
RENDER/USDT is sitting at 1.502 right now, down over 35% from that high.
RSI made a lower high while price made a higher high in June.
That is the market quietly telling you the move was running on fumes before the candles ever turned red.
MACD is still negative, histogram red, signal line trailing below the MACD line. No bullish cross has printed yet.
RSI 14 is at 41, still under the midline that separates strength from weakness.
Here is the part that matters. Price is now retesting the exact 1.50 to 1.60 zone that acted as support back in March and April. That level has held before.
The people who only watch price are panicking right now.
The people who watch structure are watching for RSI to reclaim 40 and for that MACD histogram to start contracting.
That combination usually shows up before the crowd believes a bottom is real.
Until then, this is a level to watch, not a level to chase.
 69
69
 13
13
 4.5K
4.5K
2026-07-01 23:27
リリース後のRENDERのトレンド
中立
RENDER/USDT has slipped to the critical support zone of 1.50-1.60, technical indicators are weak, and bottom signals need to be observed.
2xnmore
FA_Analyst
OnChain_Analyst
B
45.2K @2xnmore 強気
RENDER/USDT has slipped to the critical support zone of 1.50-1.60, technical indicators are weak, and bottom signals need to be observed.
Everyone celebrated $RENDER hitting 2.40 in June.
Almost nobody noticed the divergence forming underneath it.
RENDER/USDT is sitting at 1.502 right now, down over 35% from that high.
RSI made a lower high while price made a higher high in June.
That is the market quietly telling you the move was running on fumes before the candles ever turned red.
MACD is still negative, histogram red, signal line trailing below the MACD line. No bullish cross has printed yet.
RSI 14 is at 41, still under the midline that separates strength from weakness.
Here is the part that matters. Price is now retesting the exact 1.50 to 1.60 zone that acted as support back in March and April. That level has held before.
The people who only watch price are panicking right now.
The people who watch structure are watching for RSI to reclaim 40 and for that MACD histogram to start contracting.
That combination usually shows up before the crowd believes a bottom is real.
Until then, this is a level to watch, not a level to chase.
69
13
4.5K
2026-07-01 12:17
リリース後のRENDERのトレンド
強気
RENDER/USDT has slipped to the critical support zone of 1.50-1.60, technical indicators are weak, and bottom signals need to be observed.

Crypto Patel
TA_Analyst
OnChain_Analyst
B
60.9K @CryptoPatel 非常に強気
RENDER处于关键累积区,基本面创新高,技术分析预测本周期有望25倍上涨至$50。
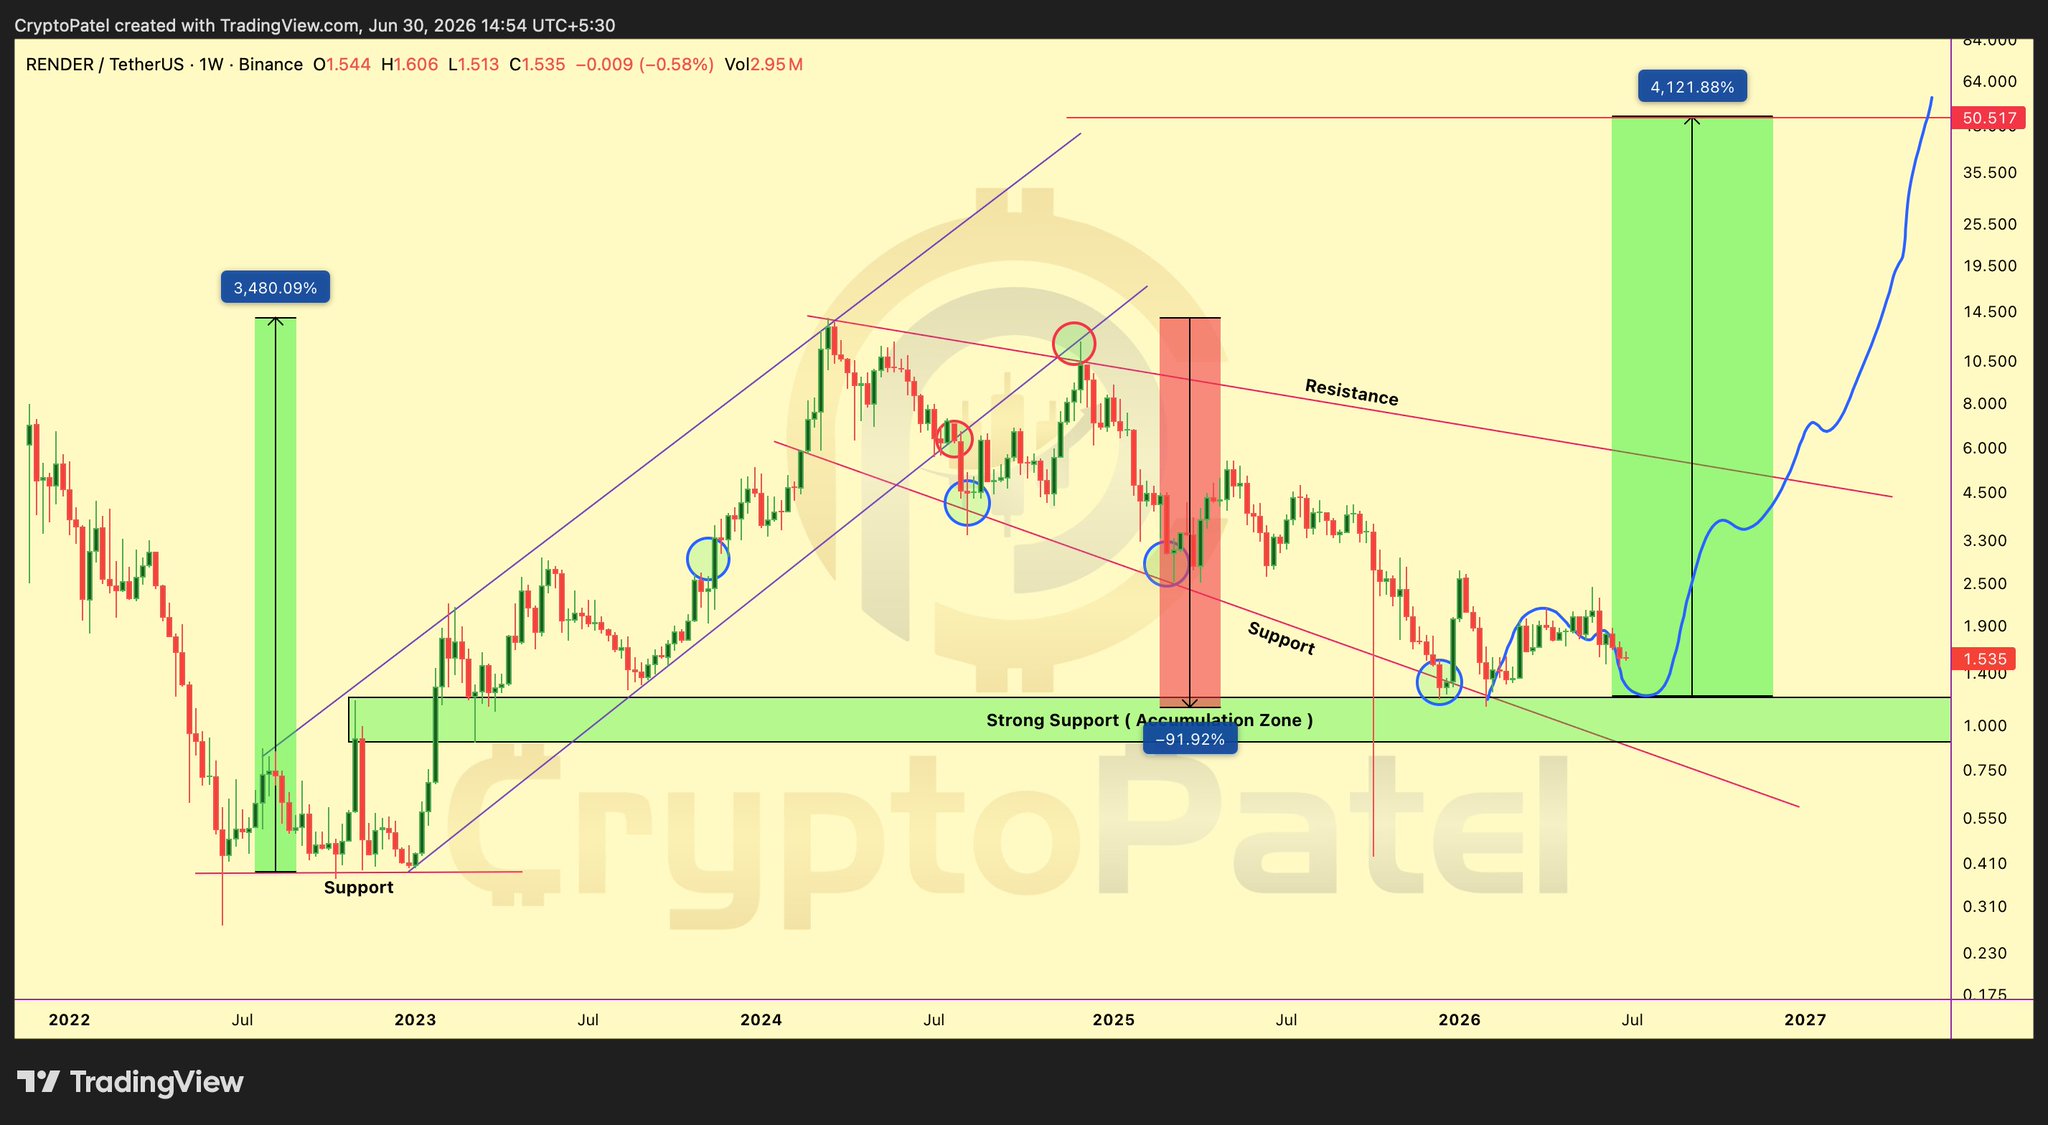
Down 92% While Fundamentals Hit ALL-TIME HIGHS: Why $RENDER Could 25x To $50 This Cycle 🚀
#RENDER Is Currently Positioned Within A HTF Bullish OB After Experiencing ~92% Macro Drawdown From Its ATH, Placing Price At A Key Accumulation vs Breakdown Zone.
Technical Structure
✅ Prior Cycle ATH: $13.83 (Macro Top)
✅ Macro Pullback: −92% From ATH Into Present Accumulation Area
✅ Multi-Year Descending Channel Compression Near HTF Demand
✅ HTF Bullish OB: $1.20–$0.80
✅ 0.786 Fibonacci Level: $0.83 (Optimal Accumulation Zone)
✅ Potential Liquidity Grab Below $1 Before Expansion
✅ Bullish Bias Holds While $0.83 Sustains On HTF Closing Basis
✅ Invalidation (Aggressive): HTF Close Below $0.83
Cycle Context
➡️ 2022–2023 Rally: +5,000% Move From $0.274 → $13.83
➡️ 2024–2026 Phase: −92% Corrective Accumulation Range
Key Levels
👉 Primary HTF Demand: $1.20–$0.80
👉 Secondary Support Zone: $0.60–$0.40 (If $0.80 Breaks)
👉 Trend Confirmation: $2.71 (Breakout From Descending Channel)
Bull Cycle Targets: $2.70 → $5.50 → $13.00 → $28+
Invalidation: Weekly Close Below $0.80
The $1.20–$0.80 Range Continues To Act As A Major HTF Accumulation Zone For RENDER/USDT Ahead Of A Potential Next Expansion Leg.
TA Only. Not Financial Advice. Manage Risk.
@render
 274
18
6.4K
274
18
6.4K
2026-06-30 14:37
リリース後のRENDERのトレンド
非常に強気
RENDER处于关键累积区,基本面创新高,技术分析预测本周期有望25倍上涨至$50。
価格予測
RENDERを購入するのに良い時期はいつですか?RENDERは今買いでしょうか、売りでしょうか?
Render(RENDER)を購入または売却する適切な時期を決定する際は、まずご自身の取引戦略とリスクプロファイルに合わせることが重要です。長期投資家と短期トレーダーは市場状況を異なる方法で解釈することが多いため、決定には個人的なアプローチを反映すべきです。 最新の RENDER 4時間テクニカル分析によると、現在の取引シグナルは ホールド です。 最新のRENDER1日テクニカル分析によると、現在のシグナルはホールドです。

ビーコン予測
の確率的価格予測(今後24時間)ビーコン予測に関する免責事項
このページに表示されるデータ結果は、選択した取引ペアの実際の取引データ(OHLCV)と対応するテクニカル指標に基づいて分析されています。
この予測は実験的な技術的成果であり、あくまで参考目的で提供しています。これは投資アドバイスをではありません。現実世界での予期せぬ出来事が市場行動に大きな影響を与える可能性があります。トレーダーは慎重に意思決定を行うべきです。
この予測は実験的な技術的成果であり、あくまで参考目的で提供しています。これは投資アドバイスをではありません。現実世界での予期せぬ出来事が市場行動に大きな影響を与える可能性があります。トレーダーは慎重に意思決定を行うべきです。
アプリバージョン Render
Render (RENDER) is a cryptocurrency launched in 2019and operates on the Ethereum platform. Render has a current supply of 533,532,274.56269149 with 518,772,101.28269149 in circulation. The last known price of Render is 1.53113605 USD and is down -1.97 over the last 24 hours. It is currently trading on 653 active market(s) with $21,328,448.33 traded over the last 24 hours. More information can be found at https://rendernetwork.com/.
続きを読む
さらに詳しく
BM Discovery


新規上場

CNT Centel
-- 0.00%

CRDOON Credo Technology Group Holding Ltd
-- 0.00%

BEON Bloom Energy Corp
-- 0.00%

DASHON DoorDash
-- 0.00%

APPON AppLovin Corporation
-- 0.00%

APLDON Applied Digital
-- 0.00%

NEEON NextEra Energy
-- 0.00%

ONON ON Semiconductor Corporation
-- 0.00%

SCHWON The Charles Schwab Corporation
-- 0.00%

ANSEM The Black Bull
-- 0.00%
購入 RENDER
取引 RENDER