

📺 Ubisoft shuts Champions Tactics Oct 30 as WEMIX loses $724K to exploit
Learn more about:
Full breakdown 👇
➡️ Watch Video: https://t.co/85N6fwxxcI
Rewards
Futures Daily Draw
100% Chance To Win With Daily Trades
現物の日次のドロー
Win 8,888 USDT In Grand Prizes
ステークして投票
投票してエアドロップを獲得
機関
プロなかつ専門的なサービス対応
BitMart VIP
限定報酬のロック解除
アカデミー
トレードとブロックチェーンについて
BitMart Internship
Start your Crypto Career Here
BitMart Travel
ワンストップグローバルトラベルサービス
モバイルチャージ
モバイルを簡単に、オンラインで、安全にチャージ
Send
Send money globally, fast and secure
BitMartモール
Live on crypto
WEMIX ライブ価格データ
WEMIXの今日の価格は$ 0.19 (WEMIX/USD)です。 時価総額$ 99.85M USD、 24時間取引量$ 448.77K USD、 24時間の価格変動+0.00%、 そして流通供給量499.36M WEMIX。
WEMIX WEMIX 価格履歴 USD
WEMIXの今日、7日間、30日間、90日間の価格を追跡
期間
24H変動幅
24H変動率 (%)
本日
$ 0
0.00%
7日
--
--
30日
--
--
90日
--
--
WEMIXを今すぐ所有
BitMartでWEMIXを簡単に安全に売買できます。
WEMIX 相場情報
$ 0.19 24H変動幅 $ 0.19
過去最高値
$ 0
過去最安値
$ 0
24H変動幅
0.00%
24H取引高
$ 448,774.22
供給量
499.36M
WEMIX
時価総額
$ 99.85M
最大供給量
0.59B
WEMIX
完全希薄化後時価総額
$ 117.97M
取引 WEMIX
WEMIX Xインサイト

PlayToEarn
Media
Researcher
D
 83.0K @PlayToEarn
 非常に弱気
WEMIX因漏洞损失724K美元,短期看空
 24
24
 7
7
 8.6K
8.6K
2026-07-31 12:57
リリース後のWEMIXのトレンド
弱気
WEMIX因漏洞损失724K美元,短期看空

Kurnia Bijaksana
Trader
Educator
C
46.9K @mkbijaksana 非常に強気
The tweet shares an altcoin trading strategy that identifies and follows rising trends when BTC dominance is falling and altcoins are bullish.
Pro tip: If the market is in a condition where
- BTC dominance is falling
- TOTAL2 shows a bullish signal
- Large altcoins are above the 21 EMA on the 1-day timeframe
Check the method below
Kurnia Bijaksana
Trader
Educator
C
46.9K @mkbijaksana DAILY CRYPTO TRADING TUTORIAL: FOLLOW THE TREND (BULLISH)
This method utilizes the follow‑the‑trend principle.
My principle: What goes up will keep going up until a reversal sign appears.
Therefore, we take advantage of assets that are gaining momentum and try to follow their upward move.
Step 1: Market Screening.
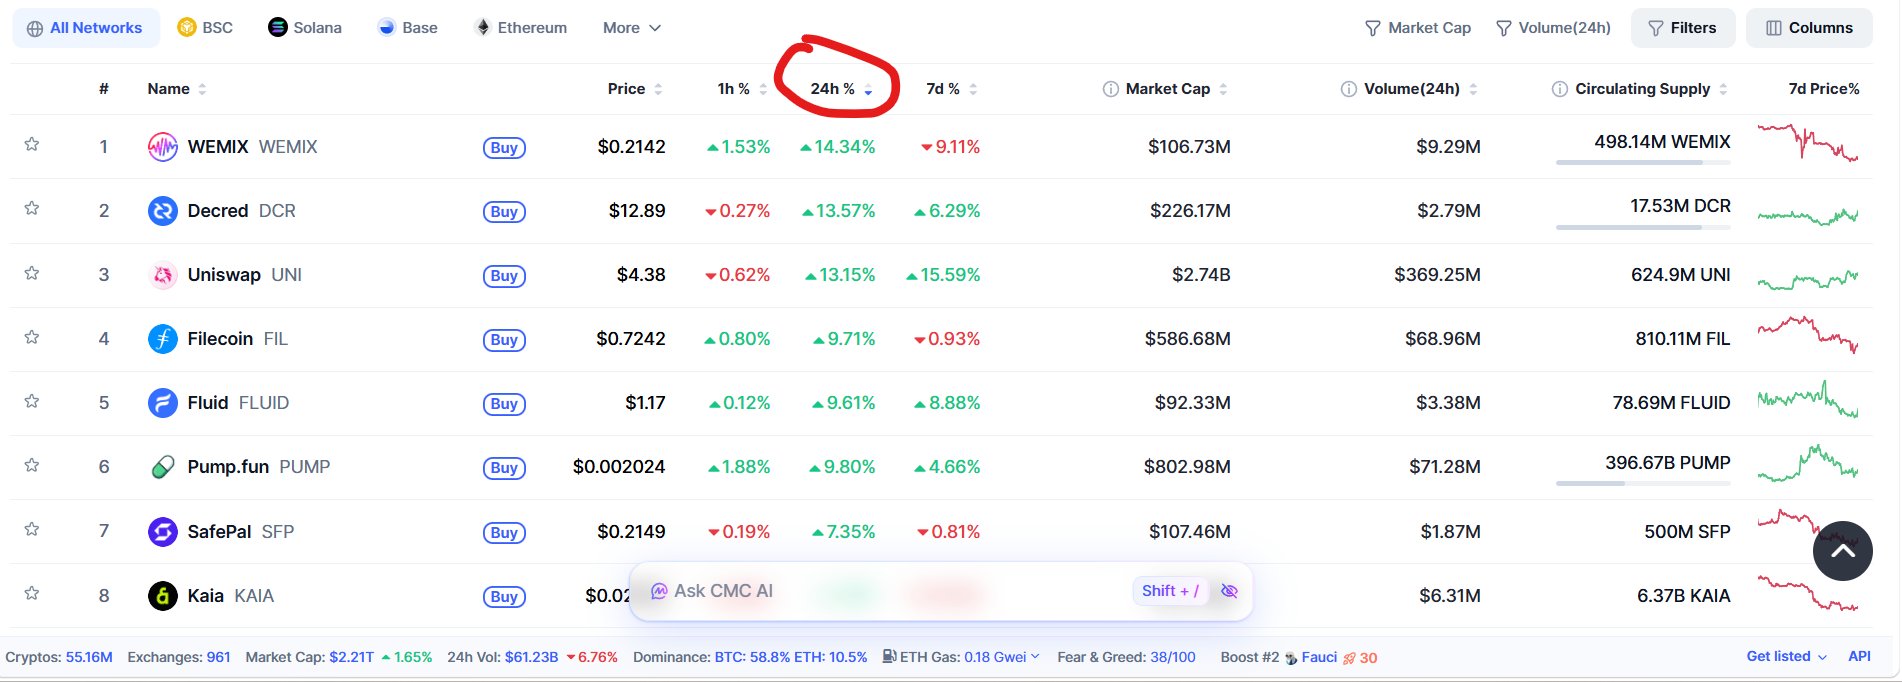
Go to CoinMarketCap, or your favorite exchange. Sort by 24H% or top gainers. You can click the 24H% or %Gains column depending on the exchange, until it lists the highest (see image 1). The example image shows WEMIX, DCR, UNI, among others.
Step 2: Ensure a bullish bias.
Open TradingView (or the exchange you use, on its chart). Switch to the 1‑day timeframe first. Make sure:
- The chart is bullish (green) and
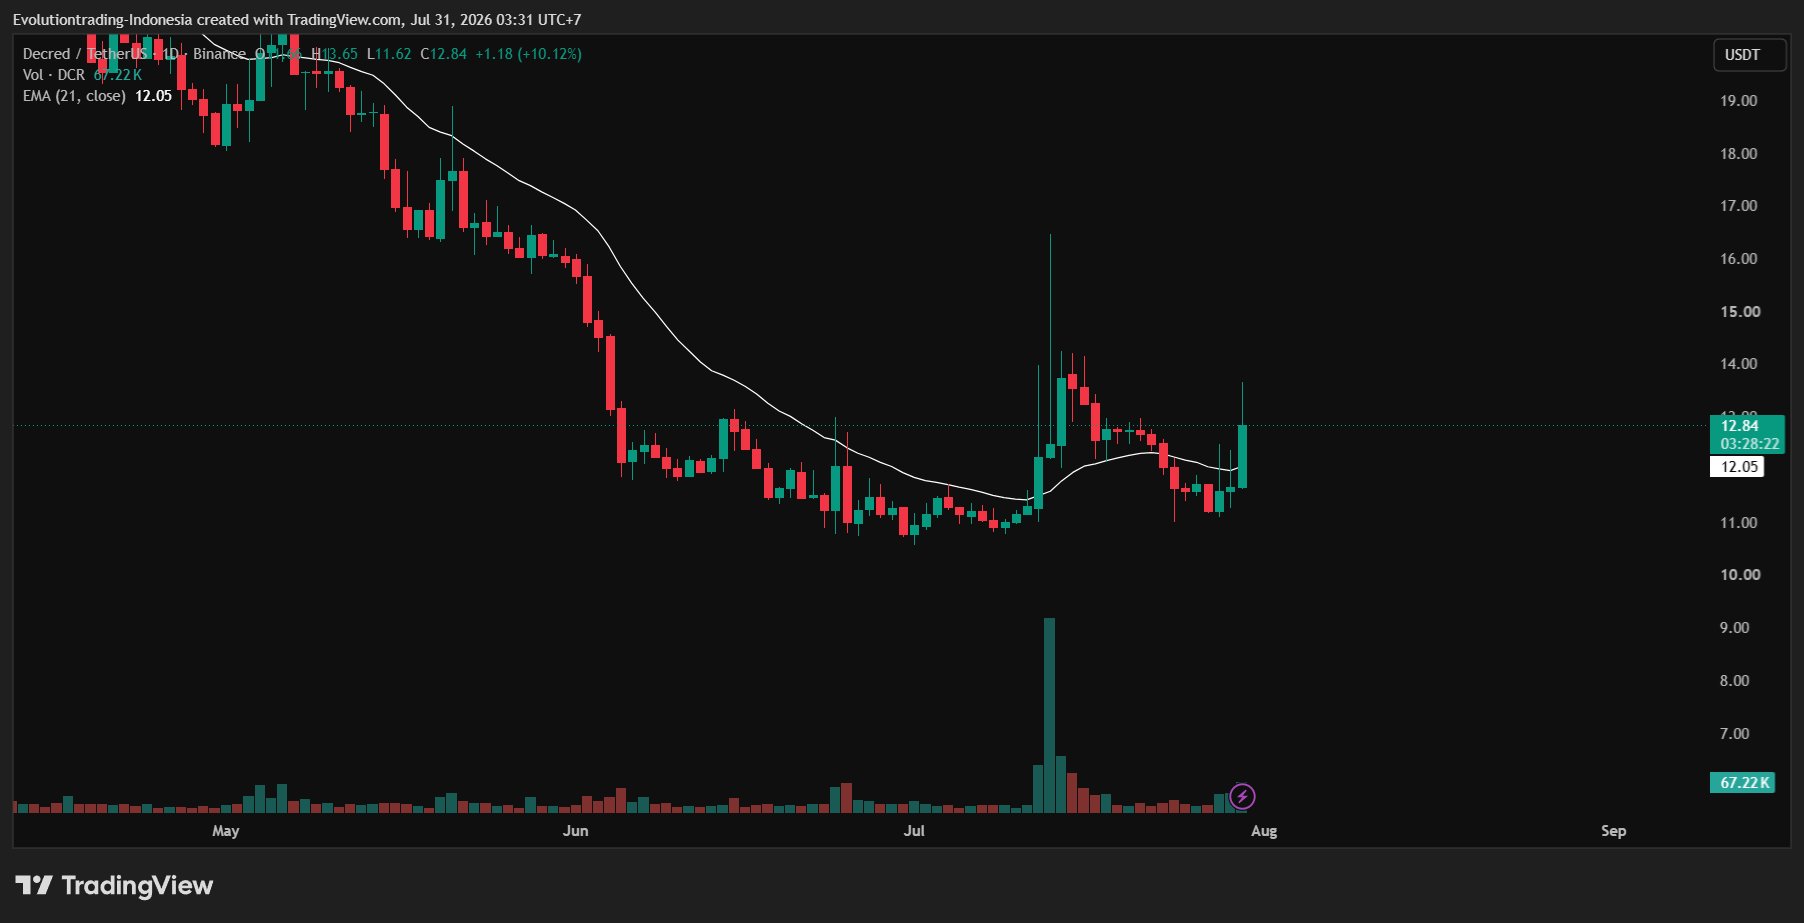
- Not too high. Avoid charts that look like tall pillars on the 1‑day timeframe; they are usually too late.
(See example in image 2)
You can look at several charts, mark those meeting the criteria, then proceed to step 3.
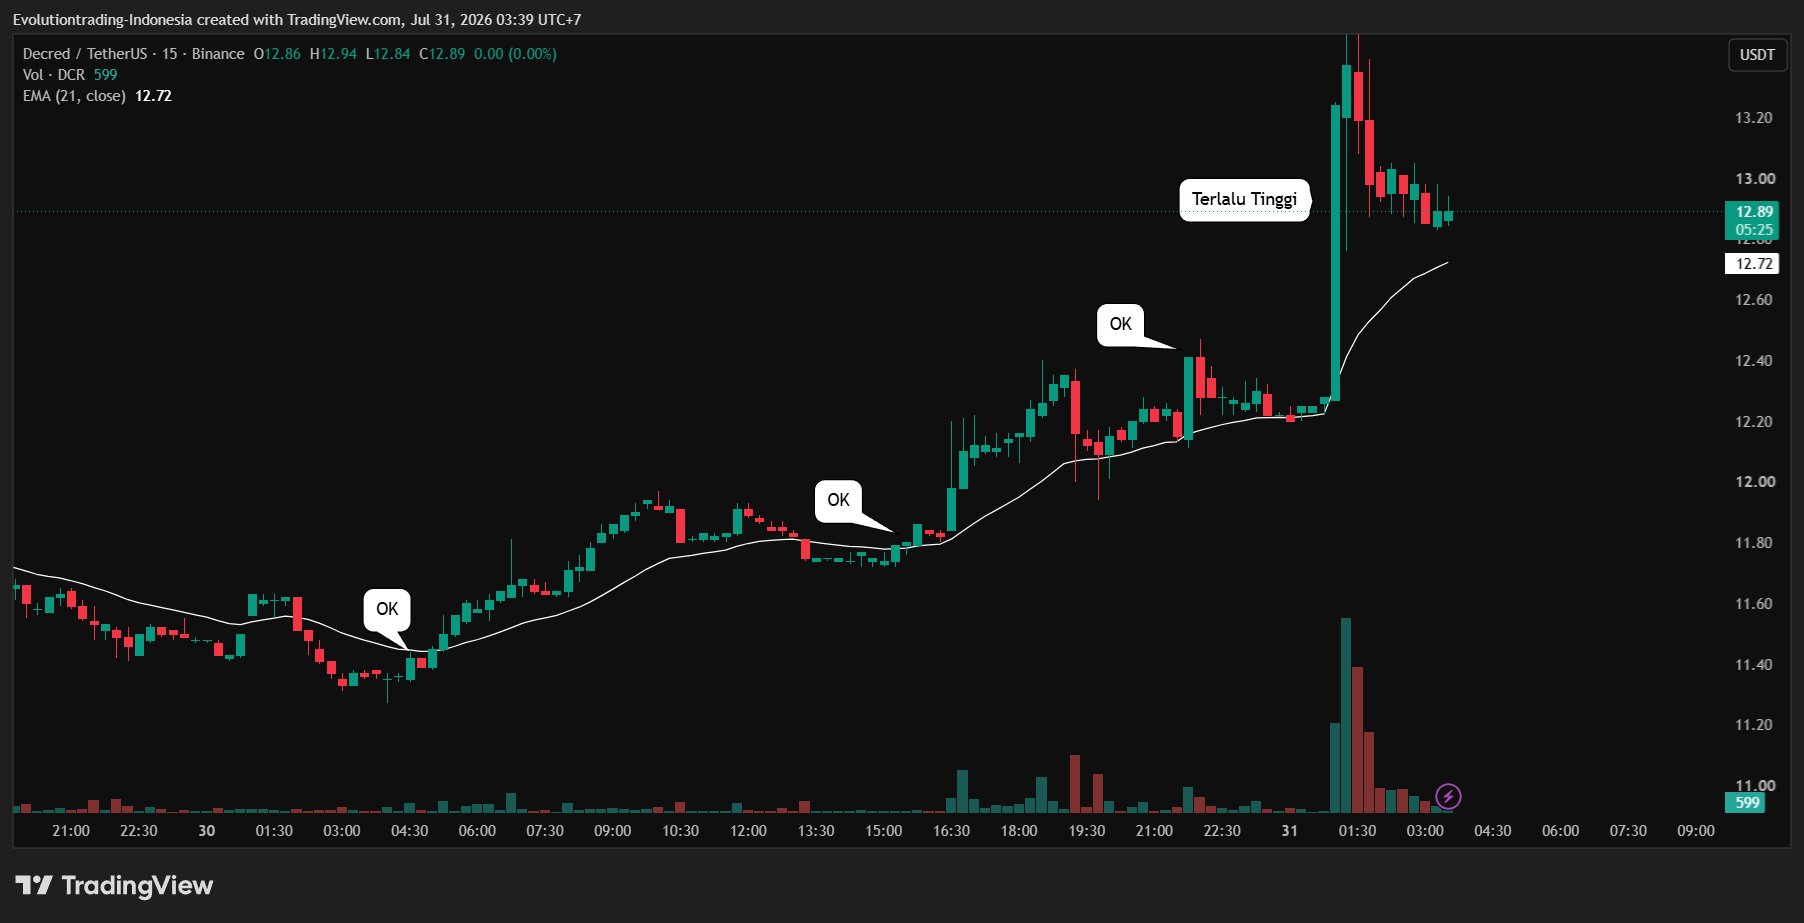
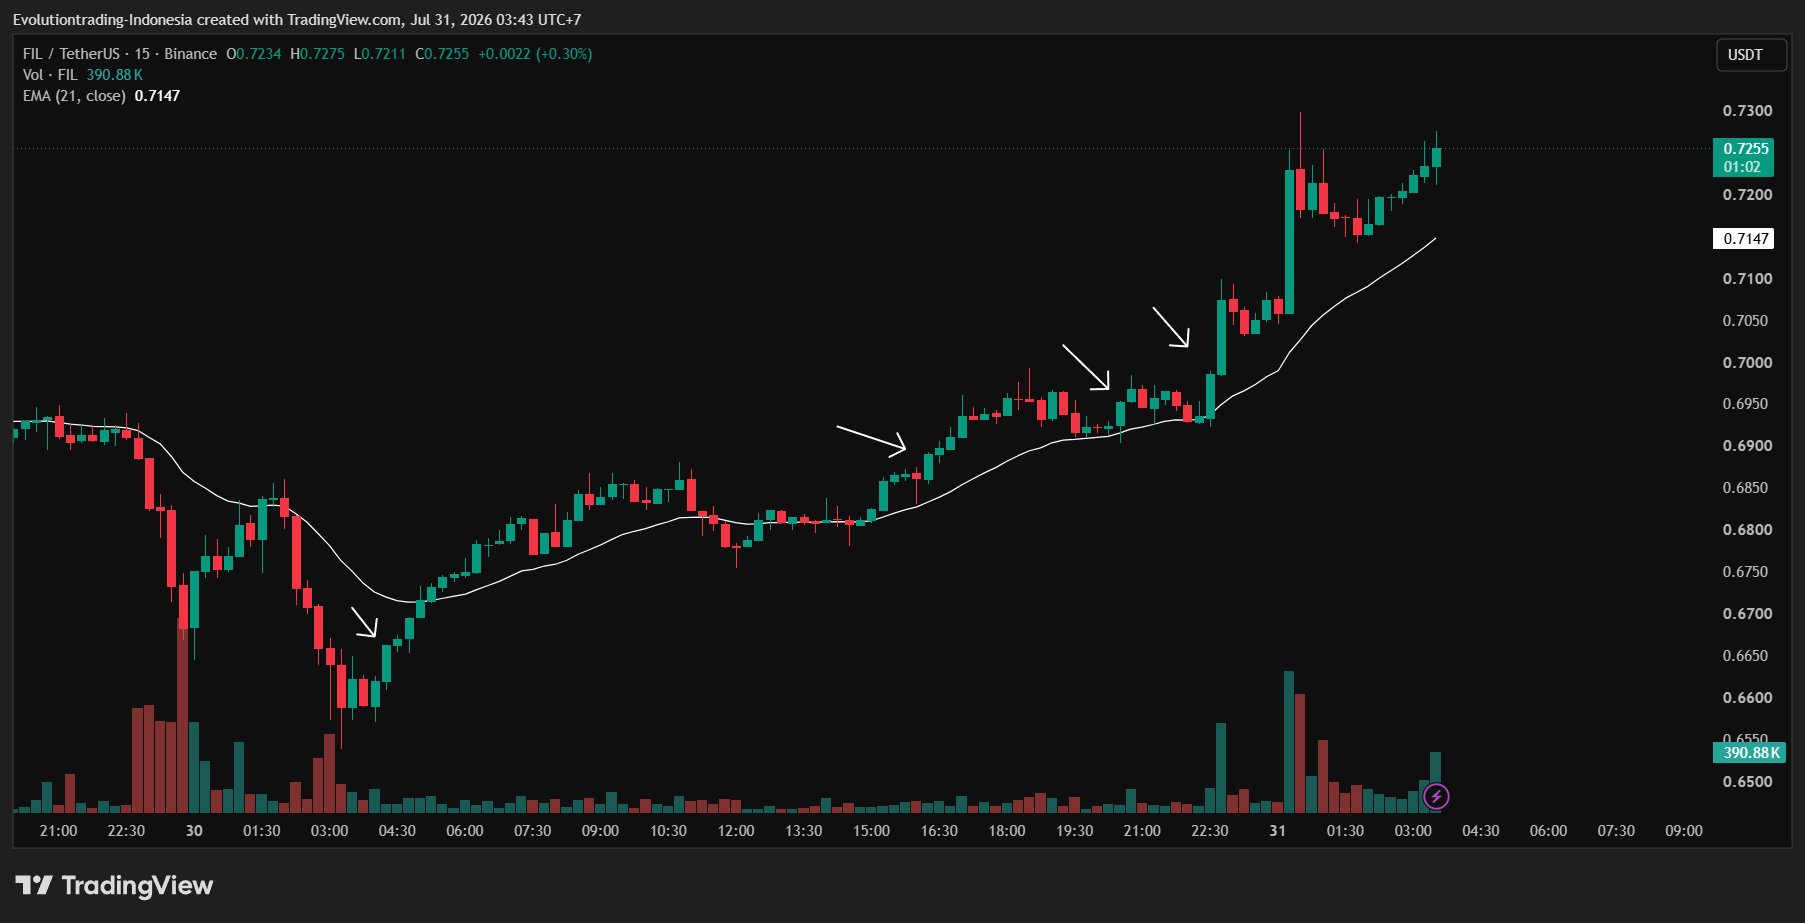
Step 3: Entry Trigger
There are many ways, I will discuss them later.
 21
0
2.3K
21
0
2.3K
2026-07-31 04:57
リリース後のWEMIXのトレンド
非常に強気
The tweet shares an altcoin trading strategy that identifies and follows rising trends when BTC dominance is falling and altcoins are bullish.
Kurnia Bijaksana
Trader
Educator
C
46.9K @mkbijaksana 強気
The tweet shares an altcoin trading strategy that identifies and follows rising trends when BTC dominance is falling and altcoins are bullish.
DAILY CRYPTO TRADING TUTORIAL: FOLLOW THE TREND (BULLISH)
This method utilizes the follow‑the‑trend principle.
My principle: What goes up will keep going up until a reversal sign appears.
Therefore, we take advantage of assets that are gaining momentum and try to follow their upward move.
Step 1: Market Screening.
Go to CoinMarketCap, or your favorite exchange. Sort by 24H% or top gainers. You can click the 24H% or %Gains column depending on the exchange, until it lists the highest (see image 1). The example image shows WEMIX, DCR, UNI, among others.
Step 2: Ensure a bullish bias.
Open TradingView (or the exchange you use, on its chart). Switch to the 1‑day timeframe first. Make sure:
- The chart is bullish (green) and
- Not too high. Avoid charts that look like tall pillars on the 1‑day timeframe; they are usually too late.
(See example in image 2)
You can look at several charts, mark those meeting the criteria, then proceed to step 3.
Step 3: Entry Trigger
There are many ways, I will discuss them later.
190
6
32.6K
2026-07-31 03:17
リリース後のWEMIXのトレンド
強気
The tweet shares an altcoin trading strategy that identifies and follows rising trends when BTC dominance is falling and altcoins are bullish.
価格予測
WEMIXを購入するのに良い時期はいつですか?WEMIXは今買いでしょうか、売りでしょうか?
WEMIX(WEMIX)を購入または売却する適切な時期を決定する際は、まずご自身の取引戦略とリスクプロファイルに合わせることが重要です。長期投資家と短期トレーダーは市場状況を異なる方法で解釈することが多いため、決定には個人的なアプローチを反映すべきです。 最新の WEMIX 4時間テクニカル分析によると、現在の取引シグナルは ホールド です。

ビーコン予測
の確率的価格予測(今後24時間)ビーコン予測に関する免責事項
このページに表示されるデータ結果は、選択した取引ペアの実際の取引データ(OHLCV)と対応するテクニカル指標に基づいて分析されています。
この予測は実験的な技術的成果であり、あくまで参考目的で提供しています。これは投資アドバイスをではありません。現実世界での予期せぬ出来事が市場行動に大きな影響を与える可能性があります。トレーダーは慎重に意思決定を行うべきです。
この予測は実験的な技術的成果であり、あくまで参考目的で提供しています。これは投資アドバイスをではありません。現実世界での予期せぬ出来事が市場行動に大きな影響を与える可能性があります。トレーダーは慎重に意思決定を行うべきです。
アプリバージョン WEMIX
WEMIX (WEMIX) is a cryptocurrency launched in 2020. WEMIX has a current supply of 560,158,782.4927065 with 499,361,870.28307045 in circulation. The last known price of WEMIX is 0.19399076 USD and is up 1.22 over the last 24 hours. It is currently trading on 65 active market(s) with $346,636.25 traded over the last 24 hours. More information can be found at http://wemix.com/.
続きを読む
購入 WEMIX
取引 WEMIX