Rewards
Futures Daily Draw
100% Chance To Win With Daily Trades
현물 일일 추첨
Win 8,888 USDT In Grand Prizes
휴대폰 요금 충전
온라인으로 간편하고 안전하게 휴대폰 요금을 충전하세요.
Send
Send money globally, fast and secure
BitMart Mall
Live on crypto

Amp Live Price data
Today's price of Amp Is $ 0.00052 (AMP/USD). With A Market Cap Of $ 45.25M USD. 24-Hour Trading Volume Of $ 130.47K USD, A 24-Hour Price Change Of -1.14%, And A Circulating Supply Of 86.78B AMP.
Amp AMP Price History USD
Track the price of Amp for today, 7 days, 30 days and 90 days
기간
변경하기
Change (%)
오늘
$ 0.0000089
-1.69%
7일
$ 0.000015
-2.97%
30일
$ 0.00032
-38.08%
90일
$ 0.00085
-62.06%
Own AMP Now
Buy and sell AMP easily and securely on BitMart.
Amp Market Information
$ 0.00051 24h Range $ 0.00054
All time high
$ 0.022
All time low
$ 0.00049
24시간 변동률
-1.14%
24시간 거래량
$ 130,469.96
유통량
86.78B
AMP
Market cap
$ 45.25M
Max supply
100.00B
AMP
Fully diluted market cap
$ 52.14M
거래하기 AMP

Amp X 인사이트

Jeremy Allaire - jerallaire.arc
창업자
인플루언서
B
 181.0K @jerallaire
 상승세
AMP는 거래 공정성 및 PFOF 리베이트 기능을 탐색 중이며, 아직 검증 단계에 있습니다.

Gordon Liao D
9.5K @gordonliao AMP는 거래 공정성, PFOF 리베이트 및 그 외 다양한 기능을 제공합니다. App-Specific Sequencing 및 고유 주문 흐름을 통해 제안자 역할을 탐색하고 싶다면 저희에게 연락 주세요.
참고: AMP는 현재 탐색 연구 단계이며 추가 검증이 필요합니다.
 100
100
 10
10
 14.9K
14.9K
2026-06-12 08:27
AMP의 출시 후 추세
상승세
AMP는 거래 공정성 및 PFOF 리베이트 기능을 탐색 중이며, 아직 검증 단계에 있습니다.

CJ Bennett
기술 분석가
교육자
B
3.5K @the_real_CJ 중립
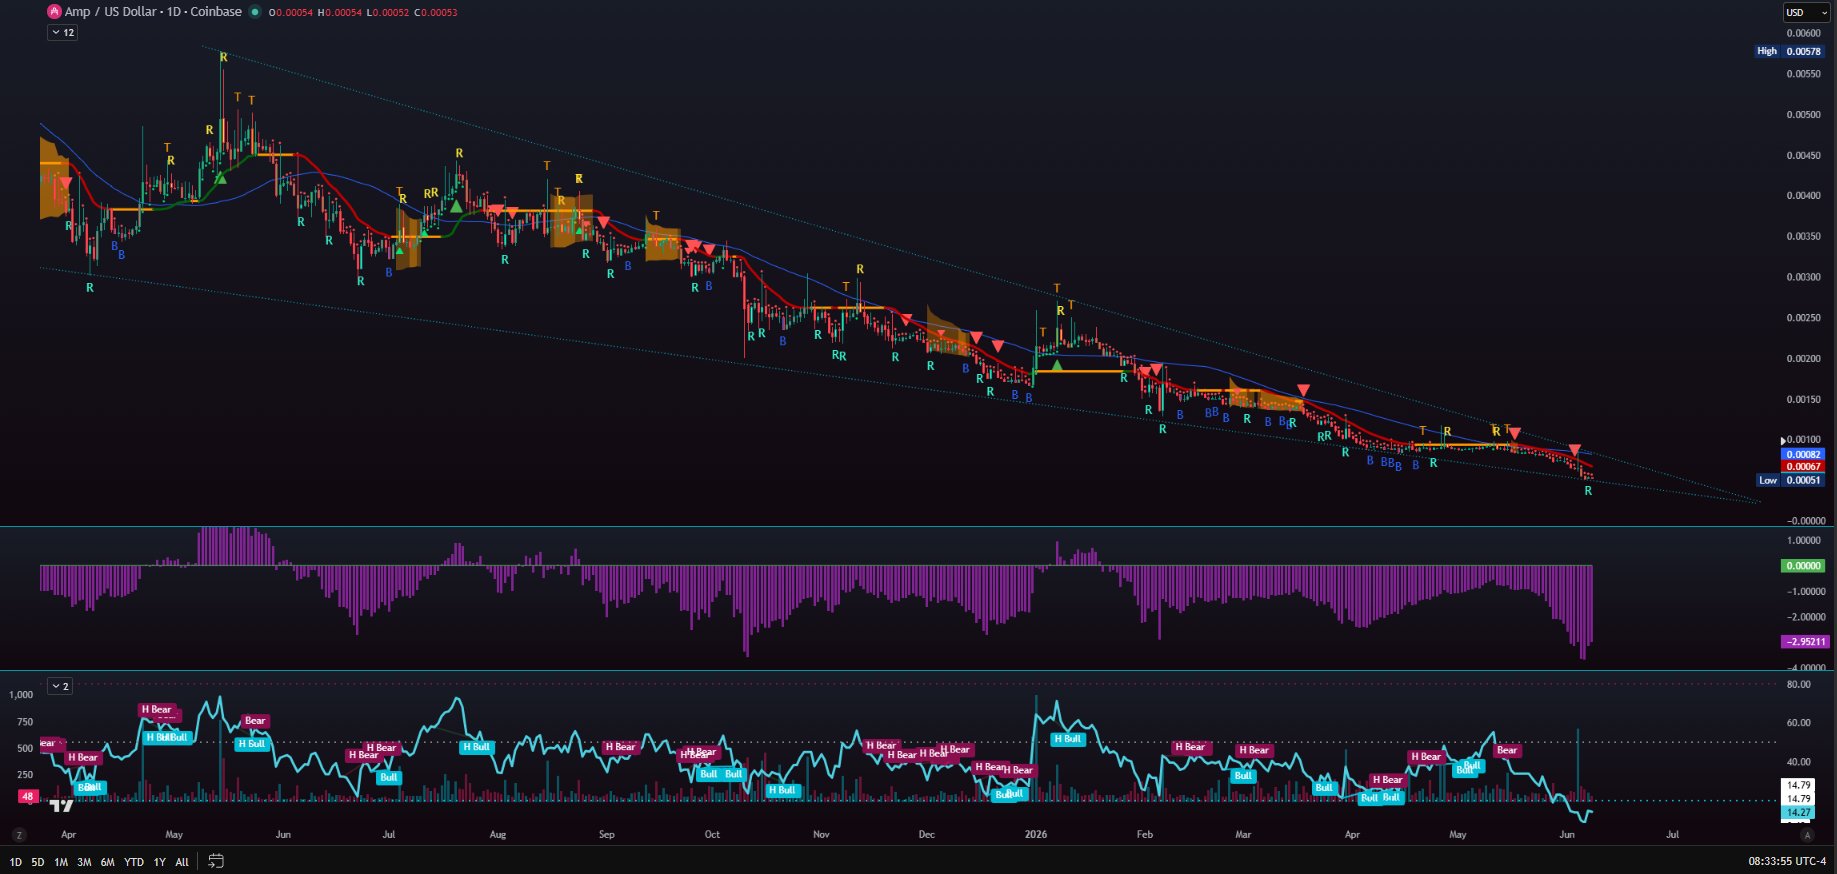
AMP는 장기 하락 쐐기 형태에 있으며, RSI가 심하게 과매도 상태이며, 7월 말까지 돌파가 이루어져 새로운 추세를 형성할 수 있는지 주시해야 합니다.
$amp
지난 몇 년과 동일한 구성을 유지하고 있습니다: 더 큰 구조 내부에 작은 구조가 있습니다. 위와 아래에서 주시해야 할 핵심 영역은 여전히 동일합니다.
하지만 시간이 지나면서 이 작은 쐐기는 더 큰 쐐기 내부에서 돌파해야 합니다. 7월 말까지 이 작은 구조는 돌파하여 새로운 추세를 만들게 됩니다. RSI는 매우 나쁘고 과매도 상태였지만, 최고 하락장 단계에 도달하면 항복이 일어납니다. 전반적으로 우리는 위와 아래의 돌파 지점을 계속 관찰해야 합니다. 이 작은 쐐기는 2025년 1월부터 존재하고 있습니다.
 43
5
1.7K
43
5
1.7K
2026-06-08 12:57
AMP의 출시 후 추세
중립
AMP는 장기 하락 쐐기 형태에 있으며, RSI가 심하게 과매도 상태이며, 7월 말까지 돌파가 이루어져 새로운 추세를 형성할 수 있는지 주시해야 합니다.

Crypto Tolga
기술 분석가
트레이더
B
79.1K @CryptoTolga_ 상승세
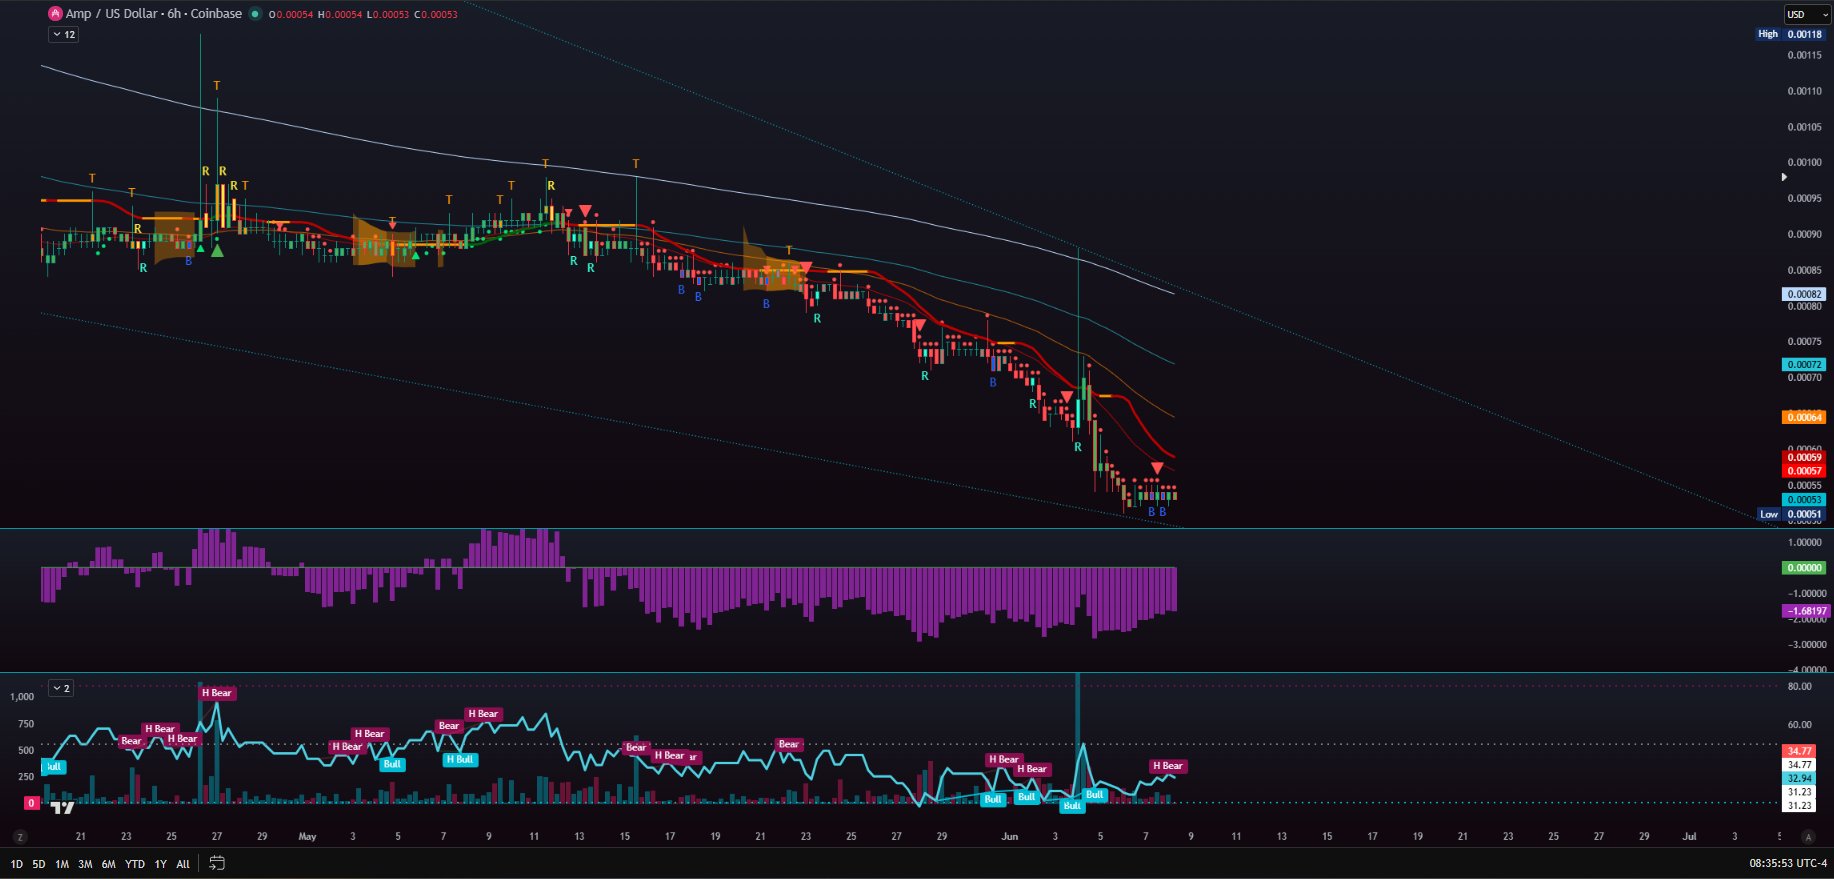
AMP 차트가 저항선을 돌파했으며, 의미 있는 상승 여력이 예상됩니다.
0
0
0
2026-06-07 05:18
AMP의 출시 후 추세
상승세
AMP 차트가 저항선을 돌파했으며, 의미 있는 상승 여력이 예상됩니다.
가격 예측
When is a good time to buy AMP? Should I buy or sell AMP now?
When deciding whether it’s a good time to buy or sell Amp (AMP), it’s important to first align with your own trading strategy and risk profile.Long-term investors and short-term traders often interpret market conditions differently, so your decision should reflect your personal approach. According to the latest AMP 4-hour technical analysis, the current trading signal is Hold. According to the latest AMP 1-day technical analysis, the current signal is Hold.

Beacon Prediction
Probabilistic Price Forecast (Next 24 Hours)Beacon Prediction Disclaimer
The data results displayed on this page are analyzed based on actual trading data (OHLCV) of the selected trading pair along with corresponding technical indicators.
This prediction is an experimental technical product and is provided for reference purposes only. It does not constitute investment advice. Unexpected real-world events may significantly impact market behavior. Traders should make decisions with caution.
This prediction is an experimental technical product and is provided for reference purposes only. It does not constitute investment advice. Unexpected real-world events may significantly impact market behavior. Traders should make decisions with caution.
소개 Amp
Amp (AMP) is a cryptocurrency launched in 2020and operates on the Ethereum platform. Amp has a current supply of 99,720,238,122.28571238 with 86,781,193,103.18022 in circulation. The last known price of Amp is 0.00053037 USD and is down -0.72 over the last 24 hours. It is currently trading on 188 active market(s) with $7,906,755.96 traded over the last 24 hours. More information can be found at https://amp.xyz.
자세히 읽어보기


매수 AMP
거래하기 AMP