$COIN #COIN Nearing the apex of the descending triangle. https://t.co/nbsGtr0H2D

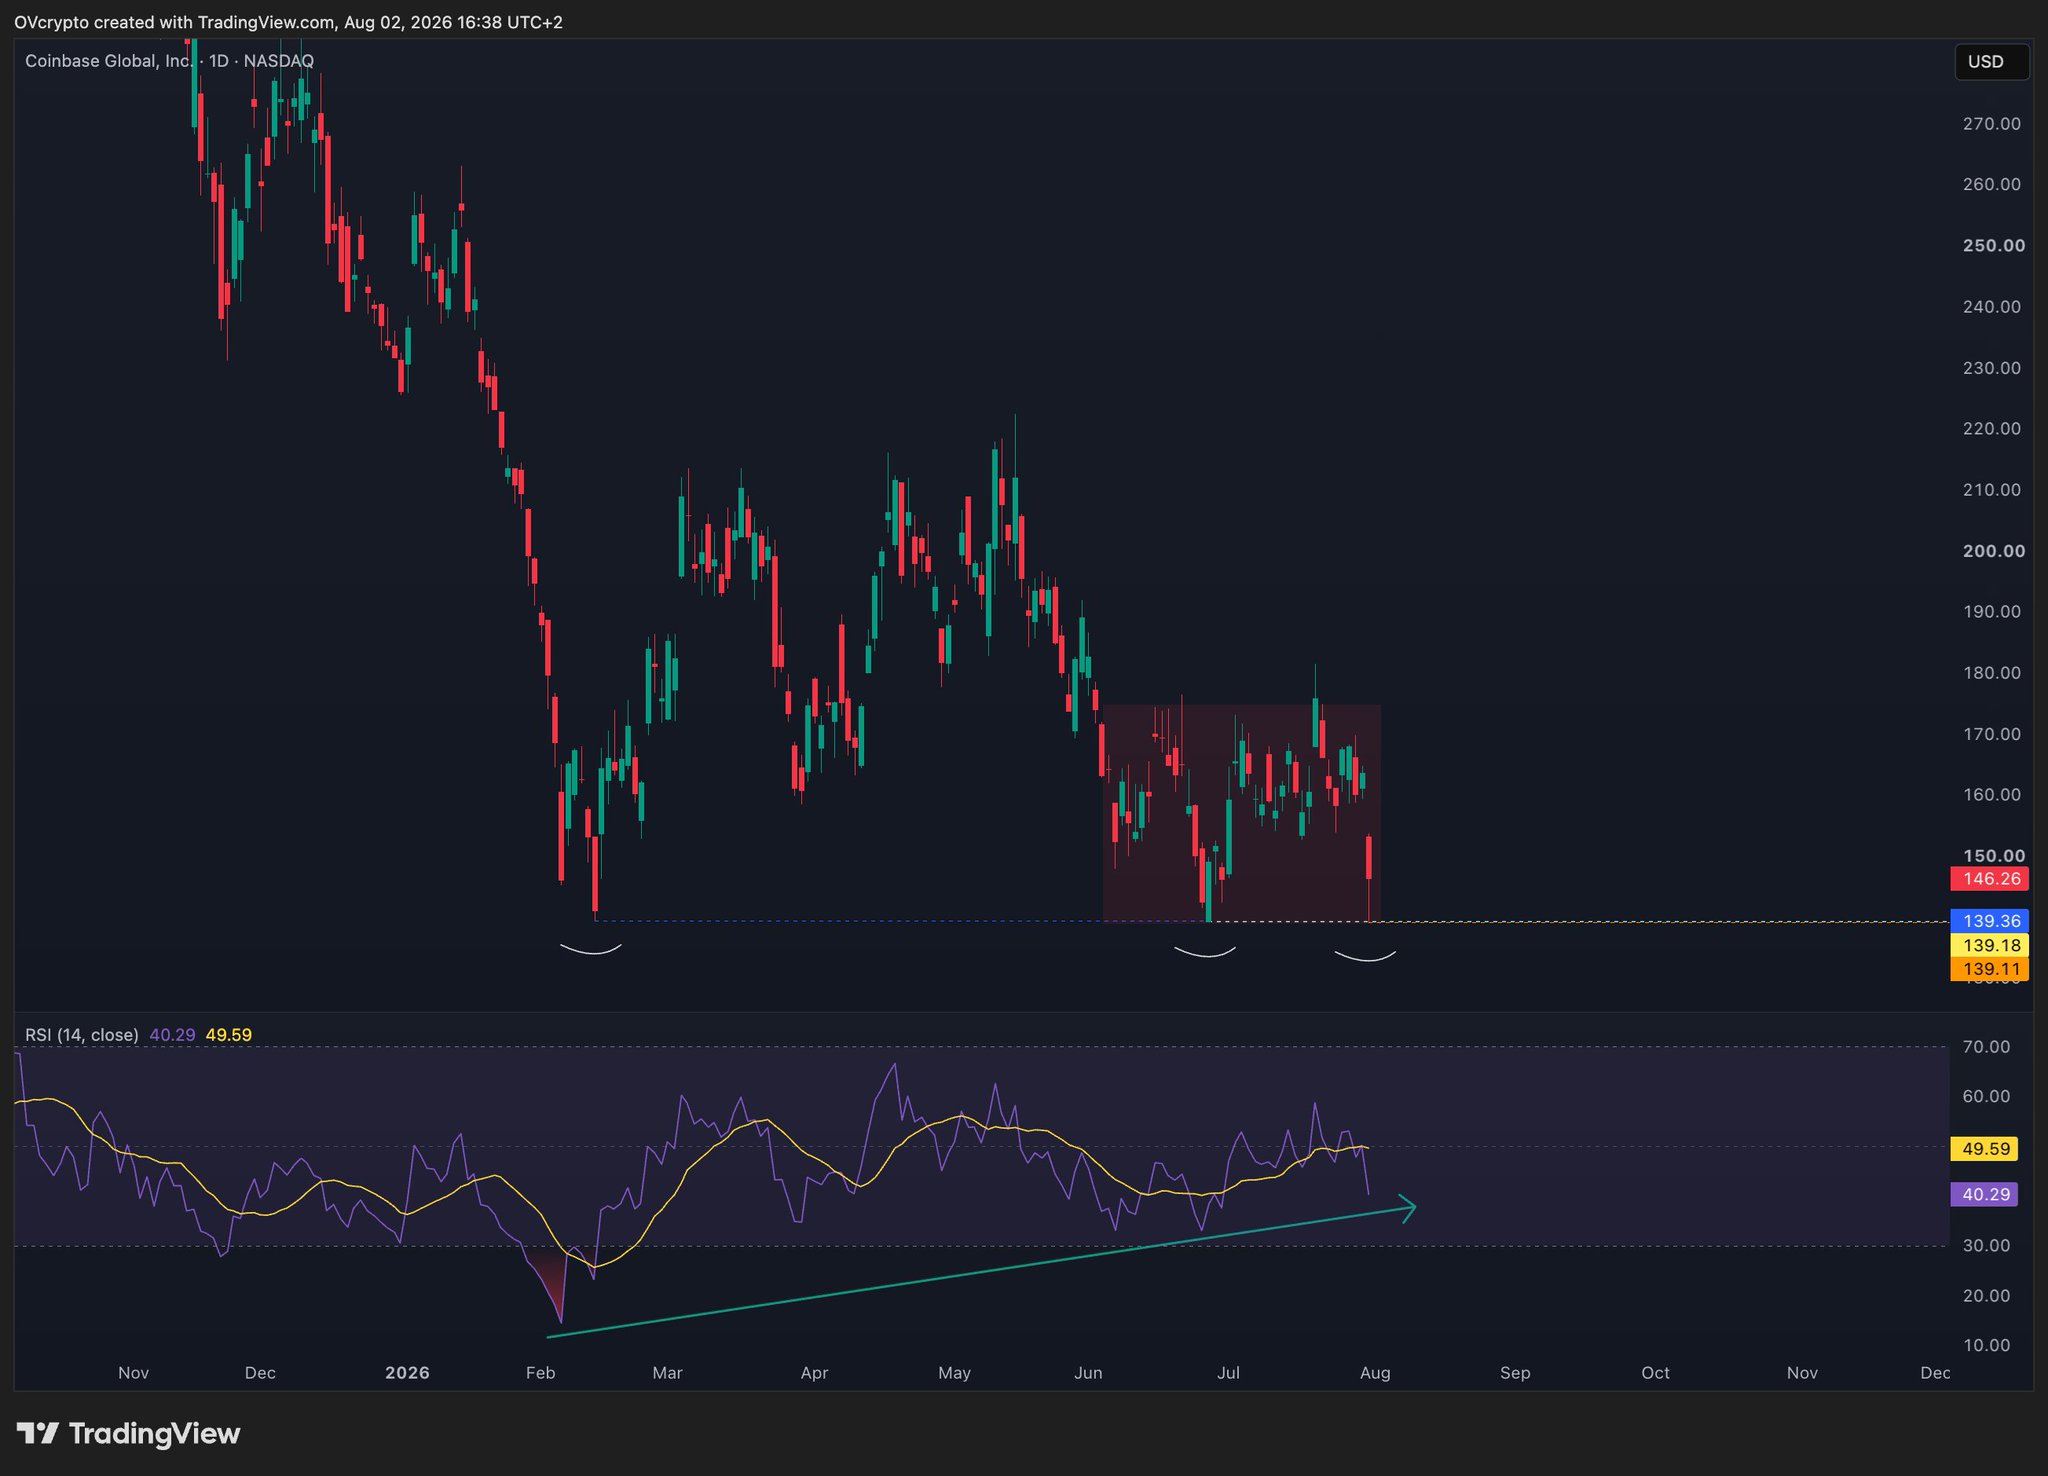
$COIN #COIN Nearing the apex of the descending triangle. https://t.co/nbsGtr0H2D
$COIN
Coinbase is currently testing the important micro-support zone after the expected pullback of the B wave has been completed. The current range could provide the foundation for further short-term recovery.
Leading scenario: The preferred assessment remains that Coinbase is completing a B wave within a larger ABC recovery. As long as the support zone of 145,50–159,20 $ holds, a further rise towards the resistance range of 176,55–202 $ is possible. Risk scenario: Should the support fail, the market could retest the lows from June and February around 138 $ before falling further towards the next Fibonacci support at 118 $. A breakout above 202 $ with a clear 5-wave impulse would instead strengthen the more bullish alternative.
Key support levels: 145,50–159,20 $ / 138 $ / 118 $ Key resistance levels: 176,55–202 $
Conclusion: Coinbase is in a critical decision zone. A bullish reaction at the support would favor another recovery phase, while a break of the support would increase the probability of further downside movement.
$COIN Weekly Gann Square
Consolidating inside the Gann arc after finding support at the horizontal + Gann arc confluence around $140 a few weeks earlier
$180 (upper bound of the Gann arc) and $210 are the critical levels to the upside. A break of $210 would likely signal that the bottoming process has completed and a renewed uptrend can begin.
The Meridian FORCE indicator is still bearish, but has flashed a momentum shift signal recently. Will watch closely for FORCE to turn bullish again.