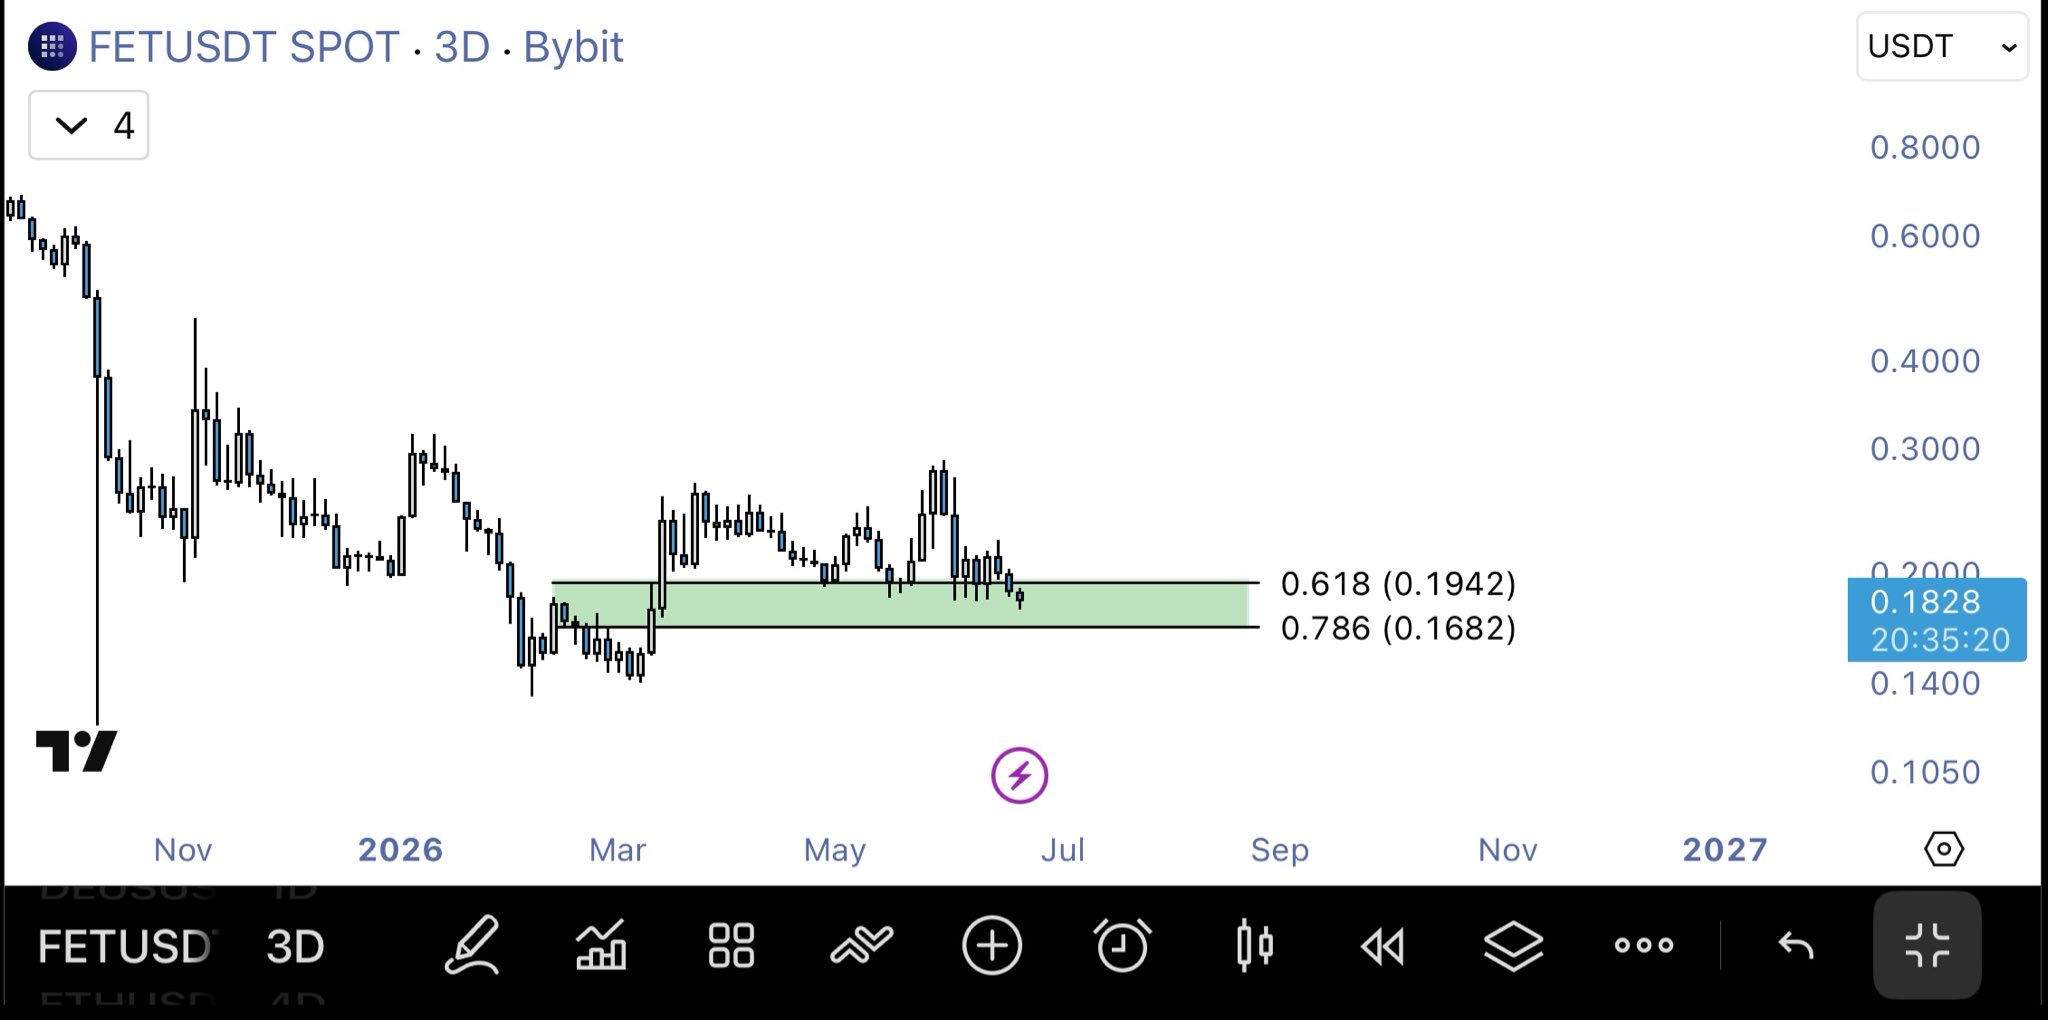
Must hold the 0.786 Fibonacci level if it wants to rise; if it breaks, it could create a new ATL for $FET https://t.co/aZpG0qRT2A


 32.6K @TalonXBT
 Must hold the 0.786 Fibonacci level if it wants to rise; if it breaks, it could create a new ATL for $FET https://t.co/aZpG0qRT2A
 71 @yuas321
 @TalonXBT $FET bro
 11
11
 1
1
 6.2K
6.2K
 1.7K @brilliantpanicc
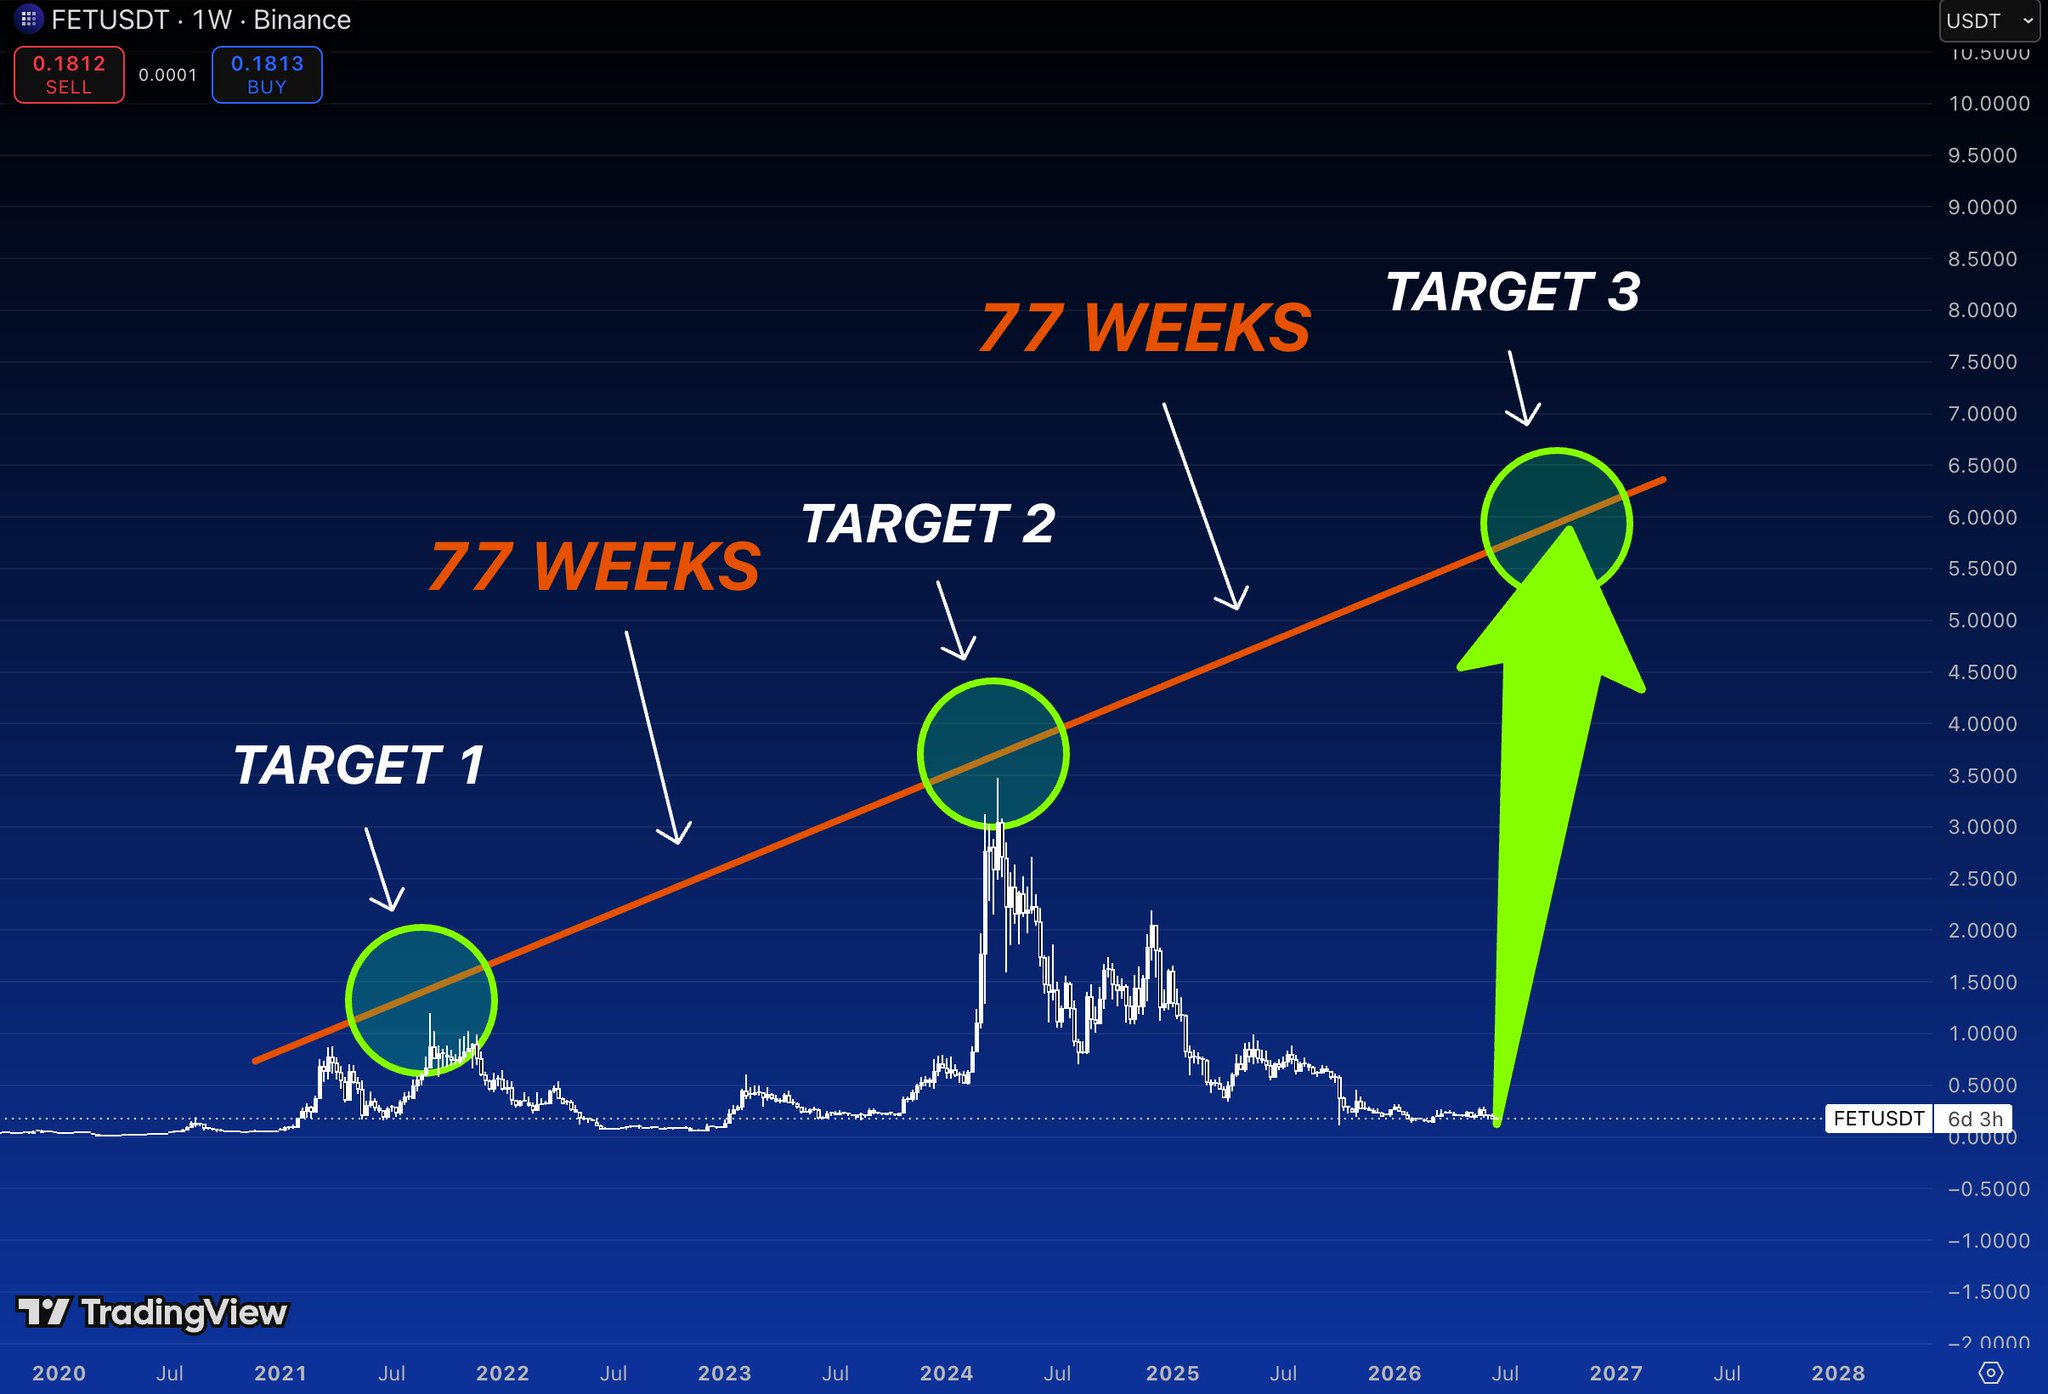
 $FET has spent the last 77 weeks doing what most traders hate:
Nothing.
After the 2024 blow‑off top, price bled lower, liquidity disappeared, and attention moved elsewhere.
But that’s exactly what makes this chart interesting.
The previous cycle shows a similar pattern:
- Long accumulation
- Sudden expansion
- Multi‑month trend higher
Now $FET is once again sitting near the same area where major moves historically began.
The market loves chasing momentum after a coin is already up 500%.
The real money is usually made during the boring phase before the expansion.
What’s catching my attention is the timing.
From the first major expansion to the next significant peak, the chart printed roughly 77 weeks.
Another 77‑week cycle projects into levels that would put $FET back into price discovery territory.
Will history repeat perfectly?
Of course not.
But markets are driven by psychology, liquidity and recurring behavior patterns.
And right now $FET is trading much closer to the floor than to the upside targets most people will suddenly become bullish on later.
Nobody cares about AI coins near the lows.
Everybody cares near the highs.
That’s usually how cycles work.
 5
0
563
5
0
563
 27.2K @i_bot404
 And $FET $TAO etc are having a 💩.
 651.2K @TrendSpider
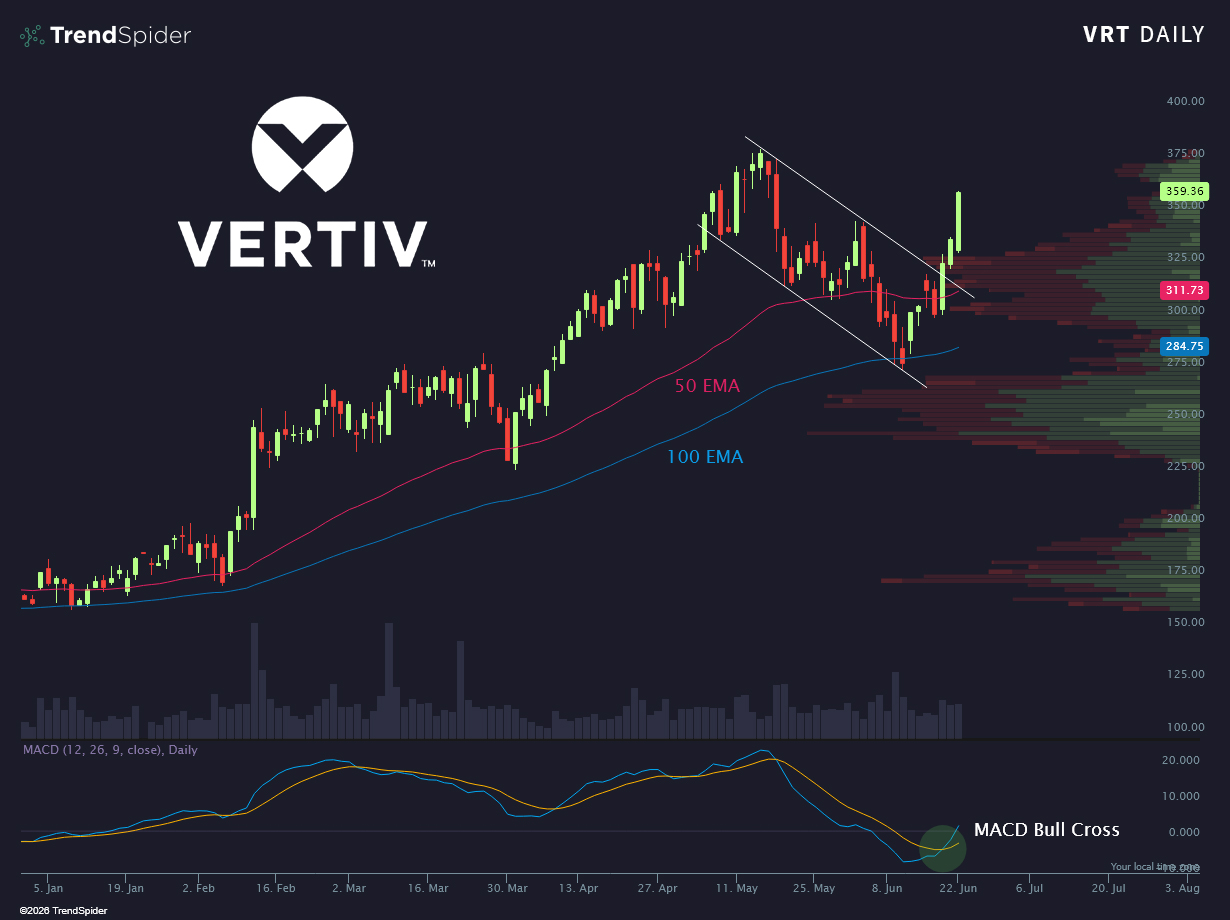
 This AI infrastructure play is getting harder to ignore 👀
$VRT https://t.co/3jCdTwjHc1
 8
0
3.0K
8
0
3.0K