$TEL is sitting where asymmetric setups are usually born
Most traders look at the current price and see a dead chart
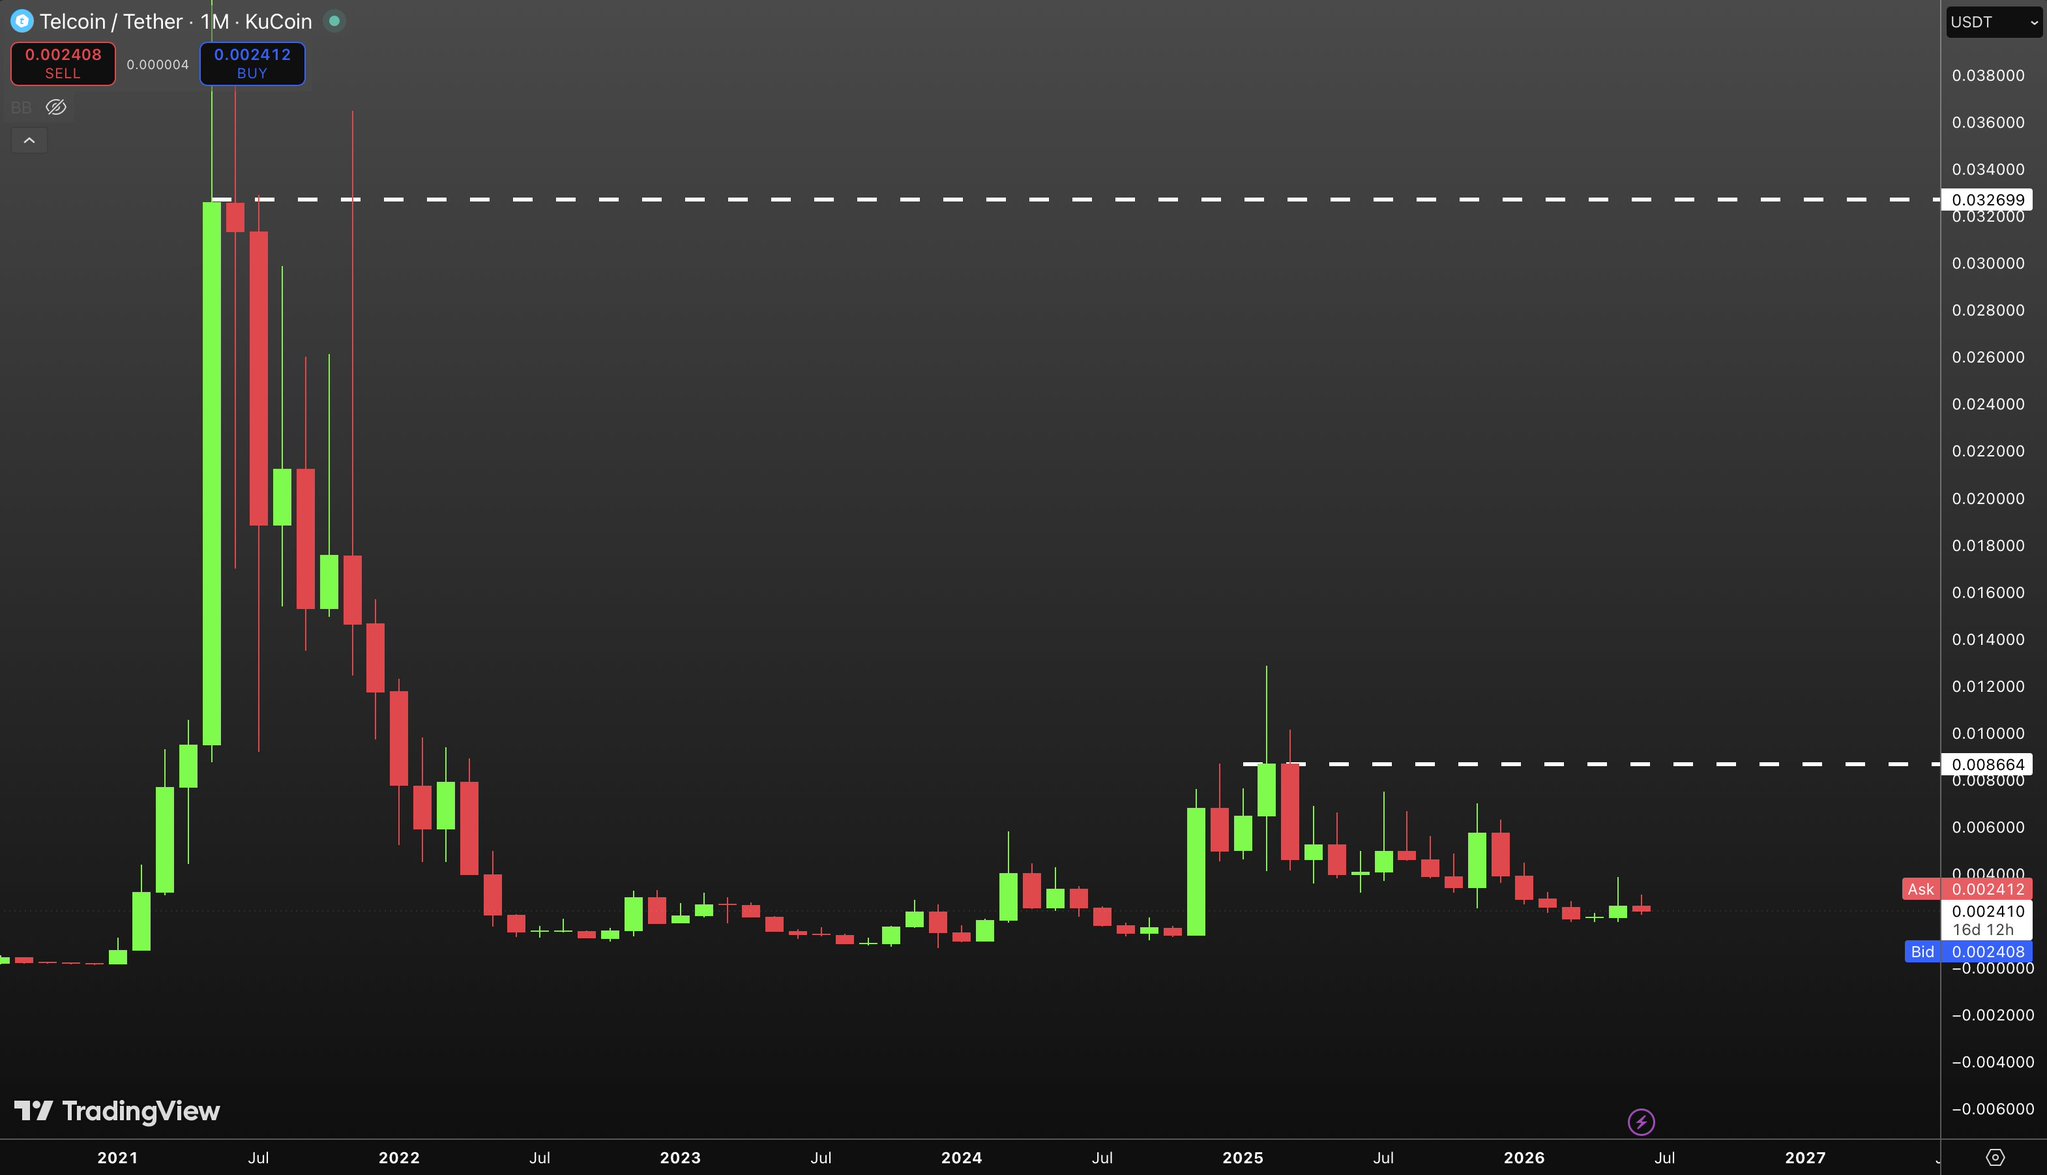
The weekly chart tells a different story
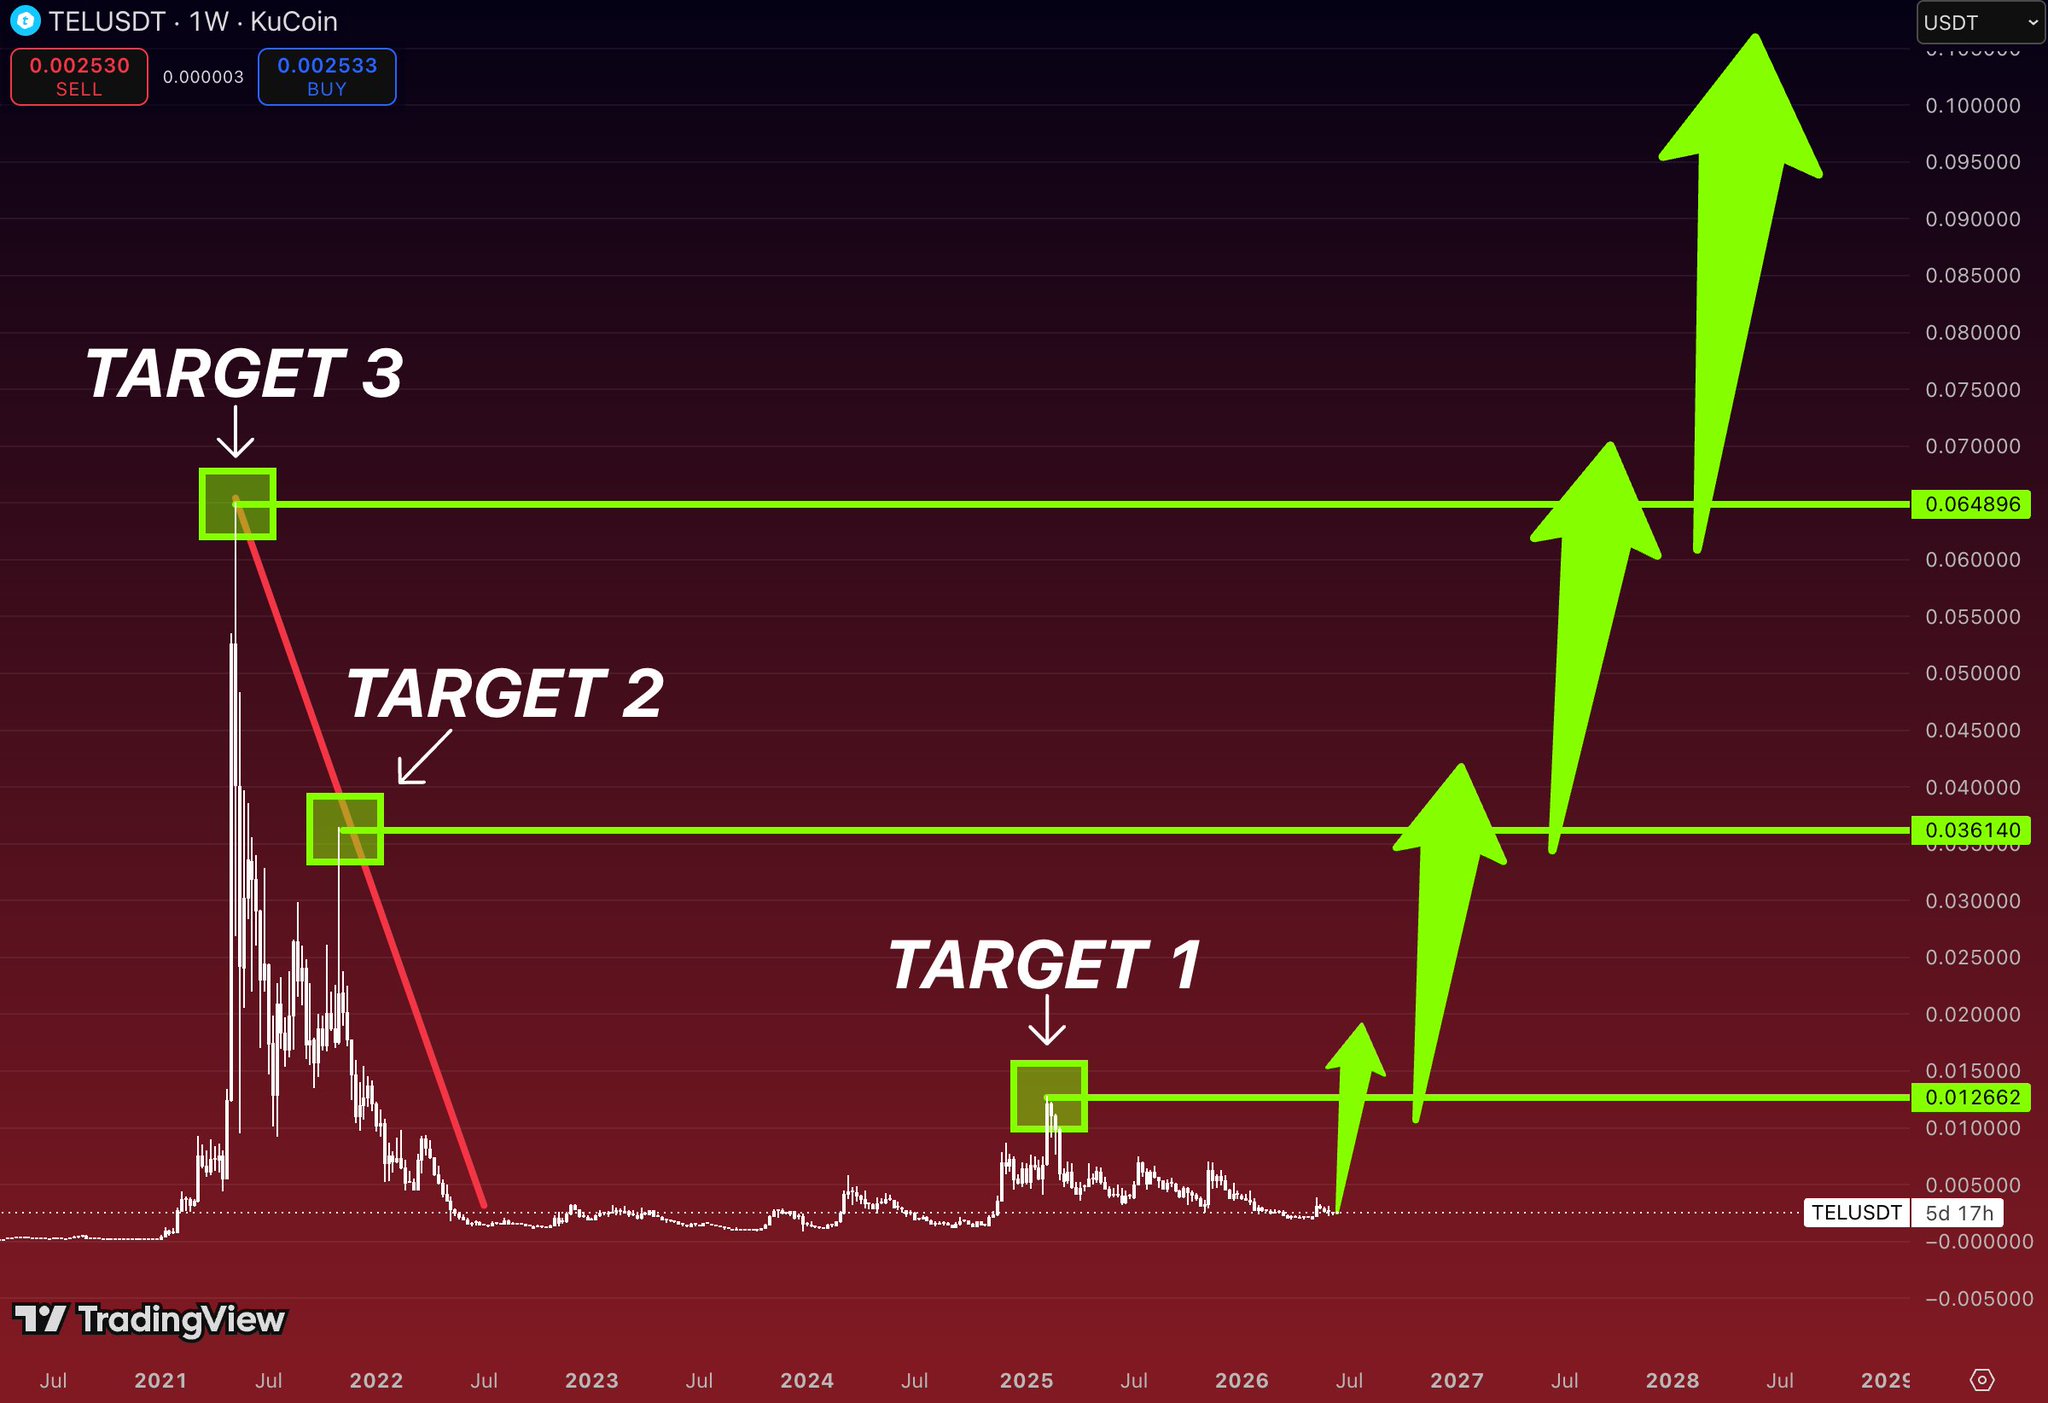
📍 Target 1: ~$0.0126
This level was a major rejection zone during the 2024 rally
If momentum returns, it’s the first meaningful resistance
📍 Target 2: ~$0.0361
Previous distribution area and one of the strongest historical supply zones on the chart
📍 Target 3: ~$0.0649
The final major resistance before entering territory that hasn’t been traded for years
Current price is around $0.0025, which means:
🚀 Target 1 = ~5x
🚀 Target 2 = ~14x
🚀 Target 3 = ~26x
What’s interesting is that price is trading extremely close to historical lows while the entire structure resembles a long accumulation range rather than active distribution
The chart suggests:
✅ Multi-year base completed
✅ Downtrend fully exhausted
✅ Risk concentrated near cycle lows
✅ Massive upside if liquidity rotates into legacy altcoins
For bulls, the key trigger is simple:
A weekly breakout from the current accumulation zone could quickly send price toward the first target around $0.0126
where the market will decide whether a full cycle expansion is underway
$TEL remains one of the highest risk/reward charts among older altcoins
because the downside is relatively compressed
while the historical resistance levels sit multiples above current price