

📺 Ubisoft shuts Champions Tactics Oct 30 as WEMIX loses $724K to exploit
Learn more about:
Full breakdown 👇
➡️ Watch Video: https://t.co/85N6fwxxcI
Mua tiền điện tử
thẻ
Giao dịch P2P
Mua USDT trên thị trường
Thẻ Credit/Debit
Mua tiền mã hóa bằng thẻ Visa hoặc MasterCard
Dịch vụ thanh toán của bên thứ ba
Mua tiền mã hóa qua MoonPay, Simplex và nhiều dịch vụ khác
BitMart Card
Giúp bạn sống theo phong cách tiền mã hóa
Thẻ trả trước tiền mã hóa
Nhận thẻ Mastercard có thể sử dụng ngay
USDⓈ-M
Sử dụng USDⓈ làm tài sản đảm bảo
COIN-M
Sử dụng chính COIN làm tài sản đảm bảo
TradFi
Dịch vụ giao dịch trọn gói cho kim loại, cổ phiếu và ngoại hối
Giao dịch demo
Tìm hiểu cách giao dịch không gặp rủi ro
Tổng quan về Futures
Nền tảng toàn diện cho Futures
Futures King
Quỹ thưởng 478,000 USDT
Tăng trưởng
Rewards
Rút thăm Futures hàng ngày
100% cơ hội chiến thắng với giao dịch hàng ngày
Rút thăm Spot hàng ngày
Nhận các giải thưởng lớn trị giá 8,888 USDT
Nạp tiền điện thoại
Nạp tiền điện thoại di động dễ dàng, online, bảo mật
Send
Send money globally, fast and secure
BitMart Mall
Trực tiếp trên tiền mã hóa
WEMIX Dữ liệu giá trực tiếp
Giá WEMIX hôm nay là $ 0.19 (WEMIX/USD). Với vốn hóa thị trường là $ 99.85M USD. Khối lượng giao dịch 24 giờ là $ 448.77K USD, Biến động giá trong 24 giờ là +0.00%, Và lượng cung lưu hành là 499.36M WEMIX.
WEMIX WEMIX Lịch sử giá USD
Theo dõi giá của WEMIX hôm nay, 7 ngày, 30 ngày và 90 ngày
Kỳ
Thay đổi
Biến động (%)
Hôm nay
$ 0
0.00%
7ngày
--
--
30ngày
--
--
90ngày
--
--
Sở hữu WEMIX ngay
Mua và bán WEMIX dễ dàng và an toàn trên BitMart.
WEMIX Thông tin thị trường
$ 0.19 Biến động 24 giờ $ 0.19
Cao nhất từng ghi nhận
$ 0
Thấp nhất từng ghi nhận
$ 0
Biến động 24 giờ
0.00%
Khối lượng 24 giờ
$ 448,774.22
Nguồn cung lưu hành
499.36M
WEMIX
Vốn hóa thị trường
$ 99.85M
Nguồn cung tối đa
0.59B
WEMIX
Vốn hóa thị trường đã pha loãng hoàn toàn
$ 117.97M
Giao dịch WEMIX
WEMIX X Insight

PlayToEarn
Media
Researcher
D
 83.0K @PlayToEarn
 Cực kỳ bi quan
WEMIX因漏洞损失724K美元,短期看空
 24
24
 7
7
 8.6K
8.6K
2026-07-31 12:57
Xu hướng của WEMIX sau khi phát hành
Giảm giá
WEMIX因漏洞损失724K美元,短期看空

Kurnia Bijaksana
Trader
Educator
C
46.9K @mkbijaksana Cực kỳ lạc quan
The tweet shares an altcoin trading strategy that identifies and follows rising trends when BTC dominance is falling and altcoins are bullish.
Pro tip: If the market is in a condition where
- BTC dominance is falling
- TOTAL2 shows a bullish signal
- Large altcoins are above the 21 EMA on the 1-day timeframe
Check the method below
Kurnia Bijaksana
Trader
Educator
C
46.9K @mkbijaksana DAILY CRYPTO TRADING TUTORIAL: FOLLOW THE TREND (BULLISH)
This method utilizes the follow‑the‑trend principle.
My principle: What goes up will keep going up until a reversal sign appears.
Therefore, we take advantage of assets that are gaining momentum and try to follow their upward move.
Step 1: Market Screening.
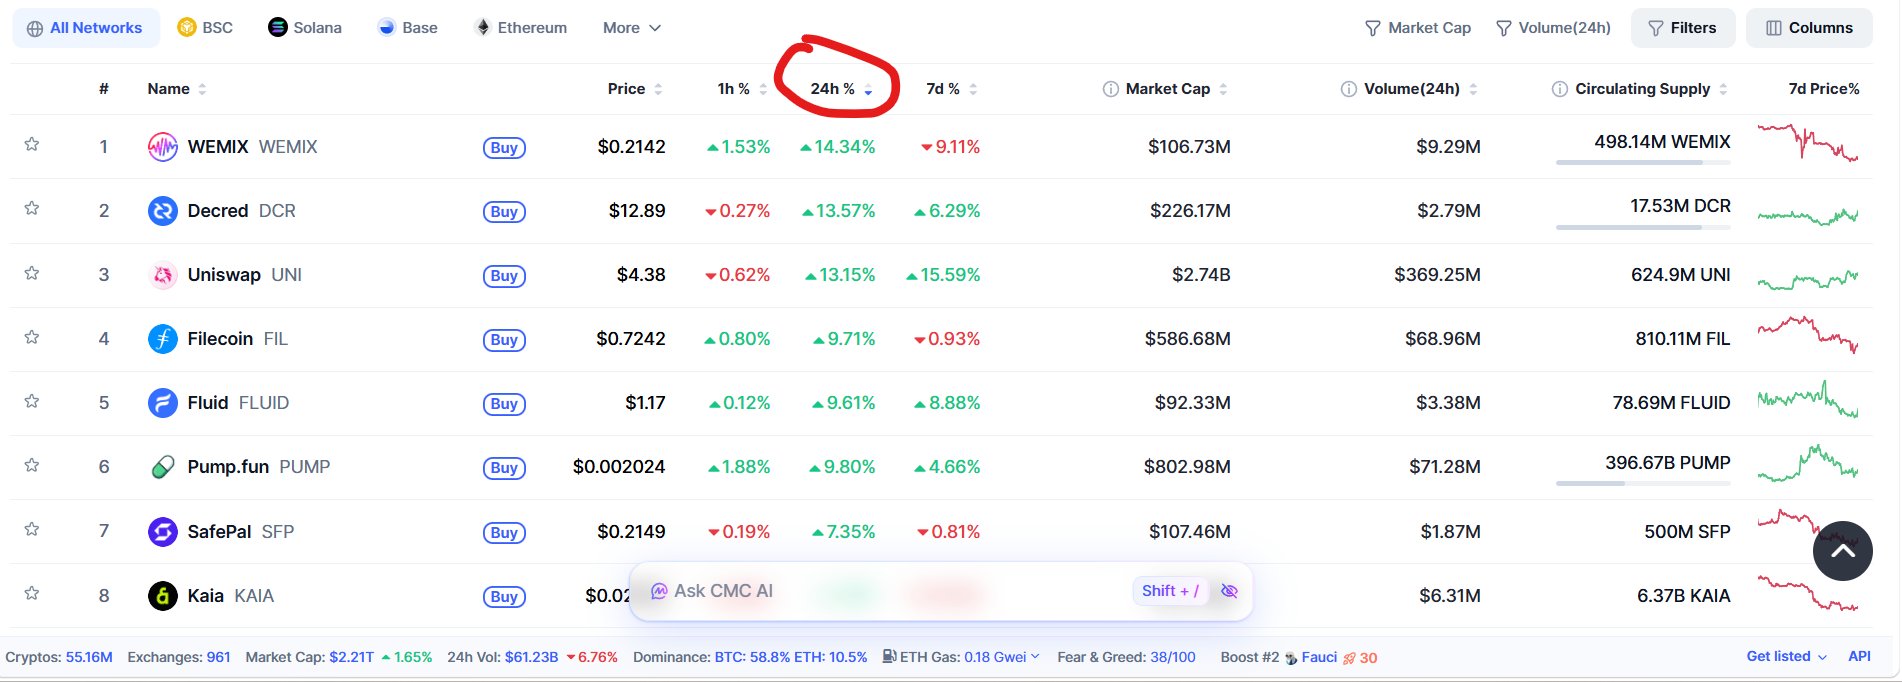
Go to CoinMarketCap, or your favorite exchange. Sort by 24H% or top gainers. You can click the 24H% or %Gains column depending on the exchange, until it lists the highest (see image 1). The example image shows WEMIX, DCR, UNI, among others.
Step 2: Ensure a bullish bias.
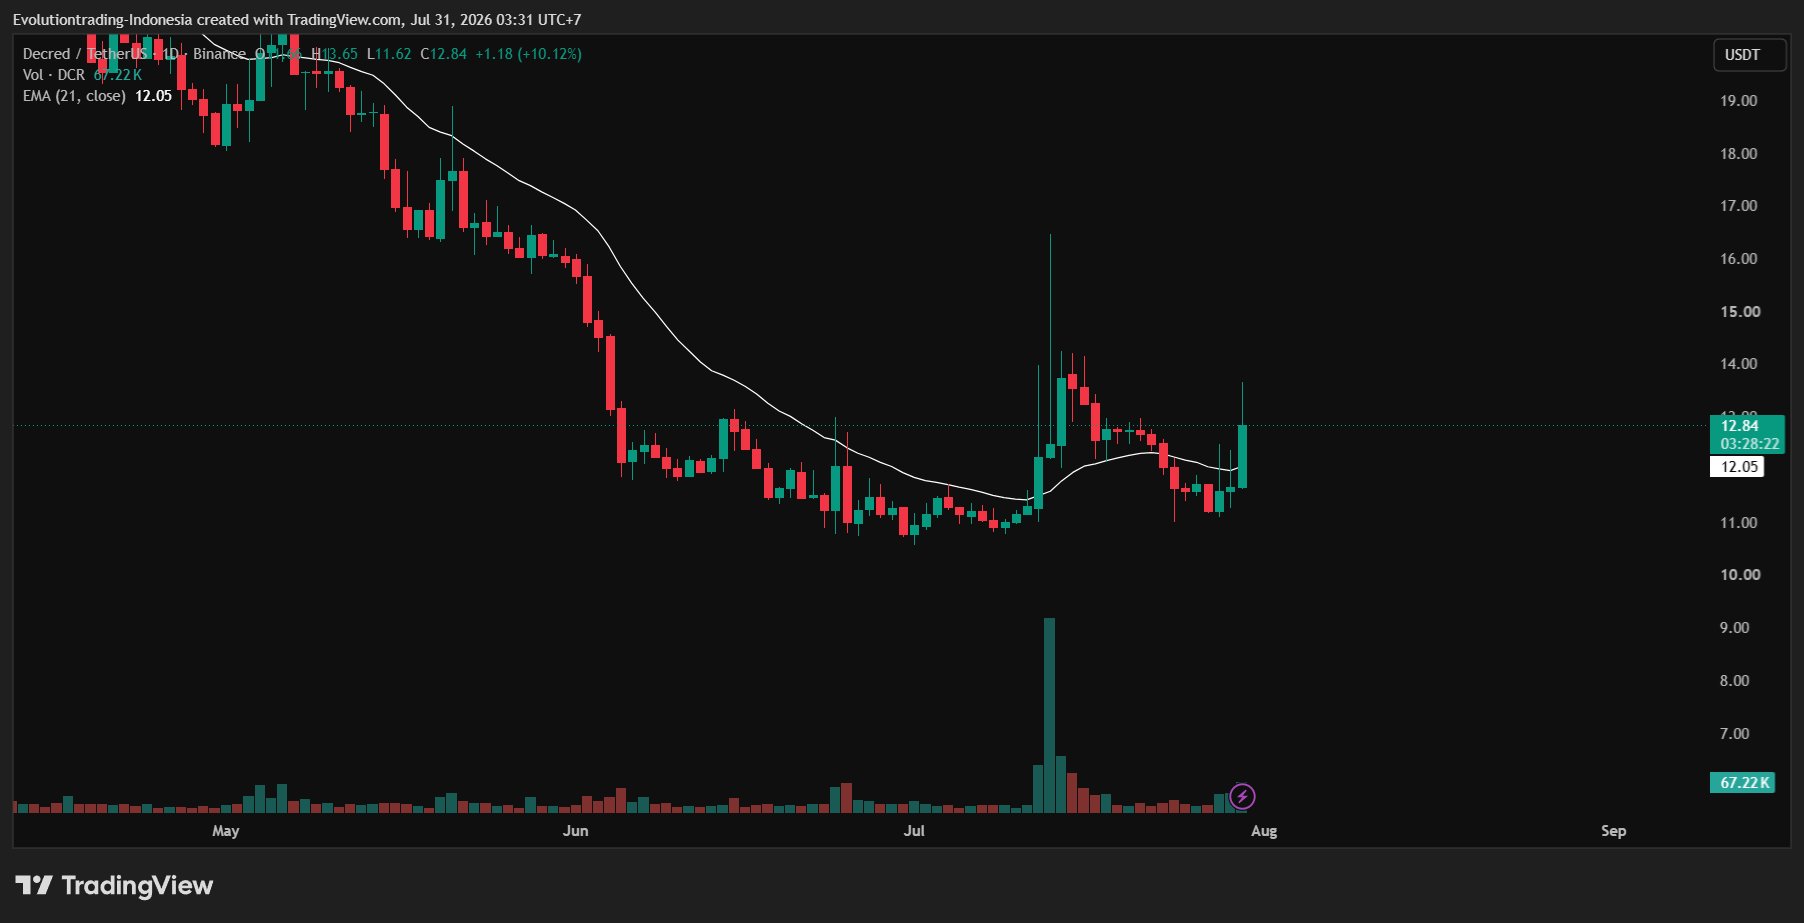
Open TradingView (or the exchange you use, on its chart). Switch to the 1‑day timeframe first. Make sure:
- The chart is bullish (green) and
- Not too high. Avoid charts that look like tall pillars on the 1‑day timeframe; they are usually too late.
(See example in image 2)
You can look at several charts, mark those meeting the criteria, then proceed to step 3.
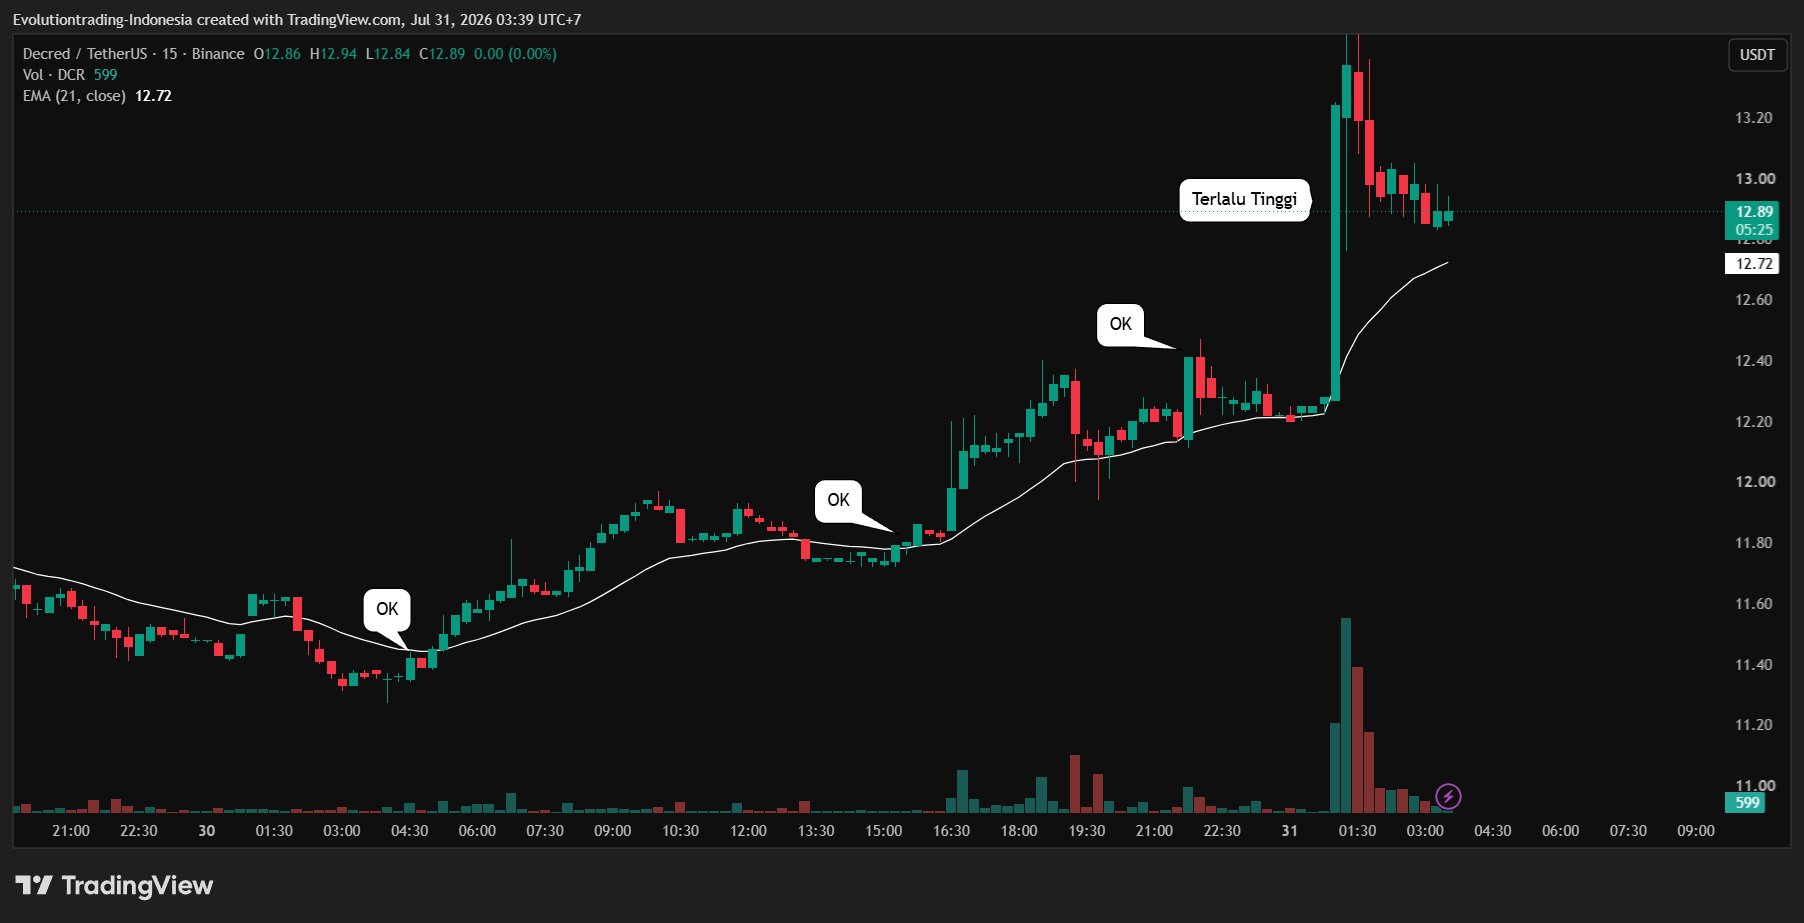
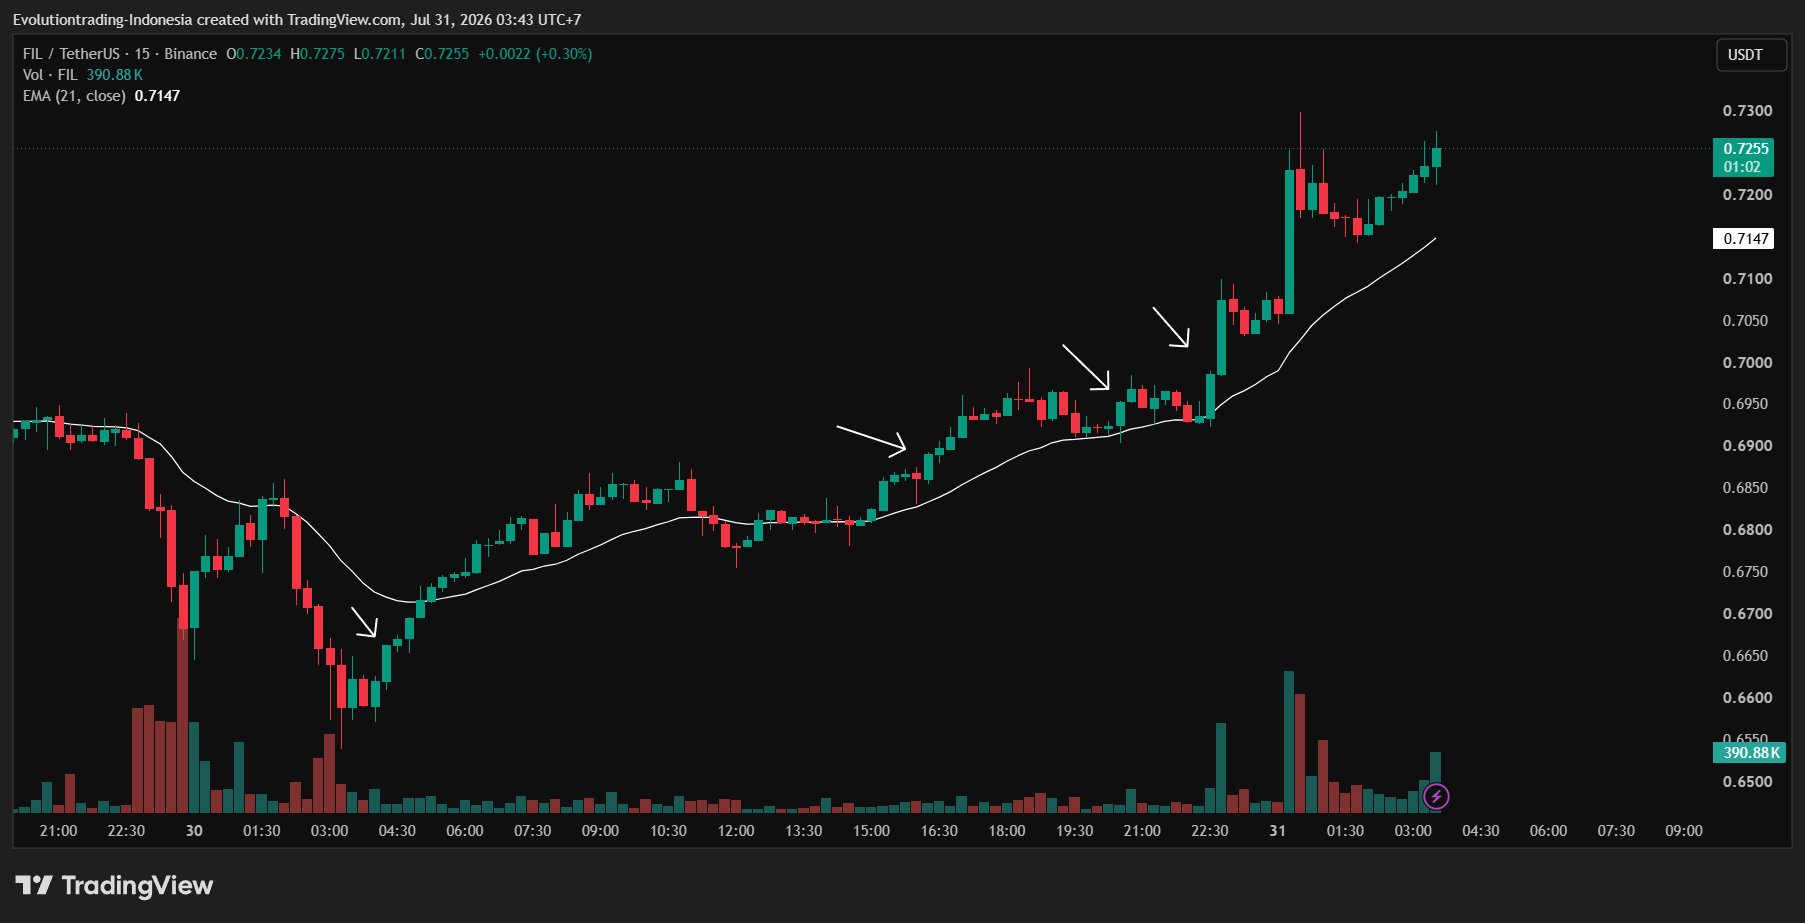
Step 3: Entry Trigger
There are many ways, I will discuss them later.
 21
0
2.3K
21
0
2.3K
2026-07-31 04:57
Xu hướng của WEMIX sau khi phát hành
Cực kỳ lạc quan
The tweet shares an altcoin trading strategy that identifies and follows rising trends when BTC dominance is falling and altcoins are bullish.
Kurnia Bijaksana
Trader
Educator
C
46.9K @mkbijaksana Tăng giá
The tweet shares an altcoin trading strategy that identifies and follows rising trends when BTC dominance is falling and altcoins are bullish.
DAILY CRYPTO TRADING TUTORIAL: FOLLOW THE TREND (BULLISH)
This method utilizes the follow‑the‑trend principle.
My principle: What goes up will keep going up until a reversal sign appears.
Therefore, we take advantage of assets that are gaining momentum and try to follow their upward move.
Step 1: Market Screening.
Go to CoinMarketCap, or your favorite exchange. Sort by 24H% or top gainers. You can click the 24H% or %Gains column depending on the exchange, until it lists the highest (see image 1). The example image shows WEMIX, DCR, UNI, among others.
Step 2: Ensure a bullish bias.
Open TradingView (or the exchange you use, on its chart). Switch to the 1‑day timeframe first. Make sure:
- The chart is bullish (green) and
- Not too high. Avoid charts that look like tall pillars on the 1‑day timeframe; they are usually too late.
(See example in image 2)
You can look at several charts, mark those meeting the criteria, then proceed to step 3.
Step 3: Entry Trigger
There are many ways, I will discuss them later.
190
6
32.6K
2026-07-31 03:17
Xu hướng của WEMIX sau khi phát hành
Tăng giá
The tweet shares an altcoin trading strategy that identifies and follows rising trends when BTC dominance is falling and altcoins are bullish.
Dự đoán giá
Thời điểm phù hợp để mua WEMIX là khi nào? Liệu tôi nên mua hay bán WEMIX bây giờ?
Khi quyết định xem đây có phải là thời điểm tốt để mua hoặc bán WEMIX (WEMIX) hay không, điều quan trọng trước tiên là phải phù hợp với chiến lược giao dịch và mức độ chấp nhận rủi ro của riêng bạn. Các nhà đầu tư dài hạn và các nhà giao dịch ngắn hạn thường diễn giải điều kiện thị trường theo các cách khác nhau, vì vậy quyết định của bạn nên phản ánh cách tiếp cận cá nhân. Theo phân tích kỹ thuật 4 giờ mới nhất của WEMIX, tín hiệu giao dịch hiện tại là Hold.

Dự đoán Beacon
Dự báo giá xác suất cho (24 giờ tới)Tuyên bố miễn trừ trách nhiệm về dự đoán Beacon
Kết quả dữ liệu hiển thị trên trang này được phân tích dựa trên dữ liệu giao dịch thực tế (OHLCV) của cặp giao dịch đã chọn cùng với các chỉ báo kỹ thuật tương ứng.
Dự đoán này là một sản phẩm kỹ thuật thử nghiệm và chỉ được cung cấp để tham khảo. Đây không phải là lời khuyên đầu tư. Những sự kiện bất ngờ trong thế giới thực có thể tác động đáng kể đến hành vi thị trường. Các nhà giao dịch nên đưa ra quyết định một cách thận trọng.
Dự đoán này là một sản phẩm kỹ thuật thử nghiệm và chỉ được cung cấp để tham khảo. Đây không phải là lời khuyên đầu tư. Những sự kiện bất ngờ trong thế giới thực có thể tác động đáng kể đến hành vi thị trường. Các nhà giao dịch nên đưa ra quyết định một cách thận trọng.
Giới thiệu WEMIX
WEMIX (WEMIX) is a cryptocurrency launched in 2020. WEMIX has a current supply of 560,158,782.4927065 with 499,361,870.28307045 in circulation. The last known price of WEMIX is 0.19399076 USD and is up 1.22 over the last 24 hours. It is currently trading on 65 active market(s) with $346,636.25 traded over the last 24 hours. More information can be found at http://wemix.com/.
Đọc thêm
Link chính thức
Trình khám phá chuỗi
Mua WEMIX
Giao dịch WEMIX