活動
合約每日抽獎
每日交易100%中獎
現貨每日抽獎
抽 8,888 USDT 豪禮
投票上幣
投票支持區塊鏈資產,賺取空投
機構
專為機構打造的解決方案
VIP
解鎖專屬福利
BitMart 學院
快速學習入門交易,瞭解區塊鏈知識
BitMart 大使
學習、建設 Web3,從 BitMart 起航
BitMart Travel
全球旅行服務,一站式預訂
BitMart話費充值
話費、流量、套餐便攜充值
轉帳
安全便捷,隨時隨地全球匯款
幣市商城
用加密貨幣滿足您的一切消費需求

AInalyst AIN 價格歷史 USD
跟蹤 AInalyst 的今日價格、7天、30天和90天價格
週期
漲跌
漲跌幅 (%)
今日
$ 0
0.00%
7日
--
--
30日
--
--
90日
--
--

AInalyst 市場信息
$ 0.000039 24小時價格浮動區間 $ 0.000039
歷史最高
$ 0
歷史最低
$ 0
24小時漲跌幅
0.00%
24小時交易量
$ 0
流通供給
244.31M
AIN
市值
$ 9,763.89
最大供給
1.00B
AIN
完全稀釋的市值
$ 39,964.72
交易 AIN

AInalyst 社交媒體動態

Crypto Tolga
TA_Analyst
Trader
B
 79.1K @CryptoTolga_
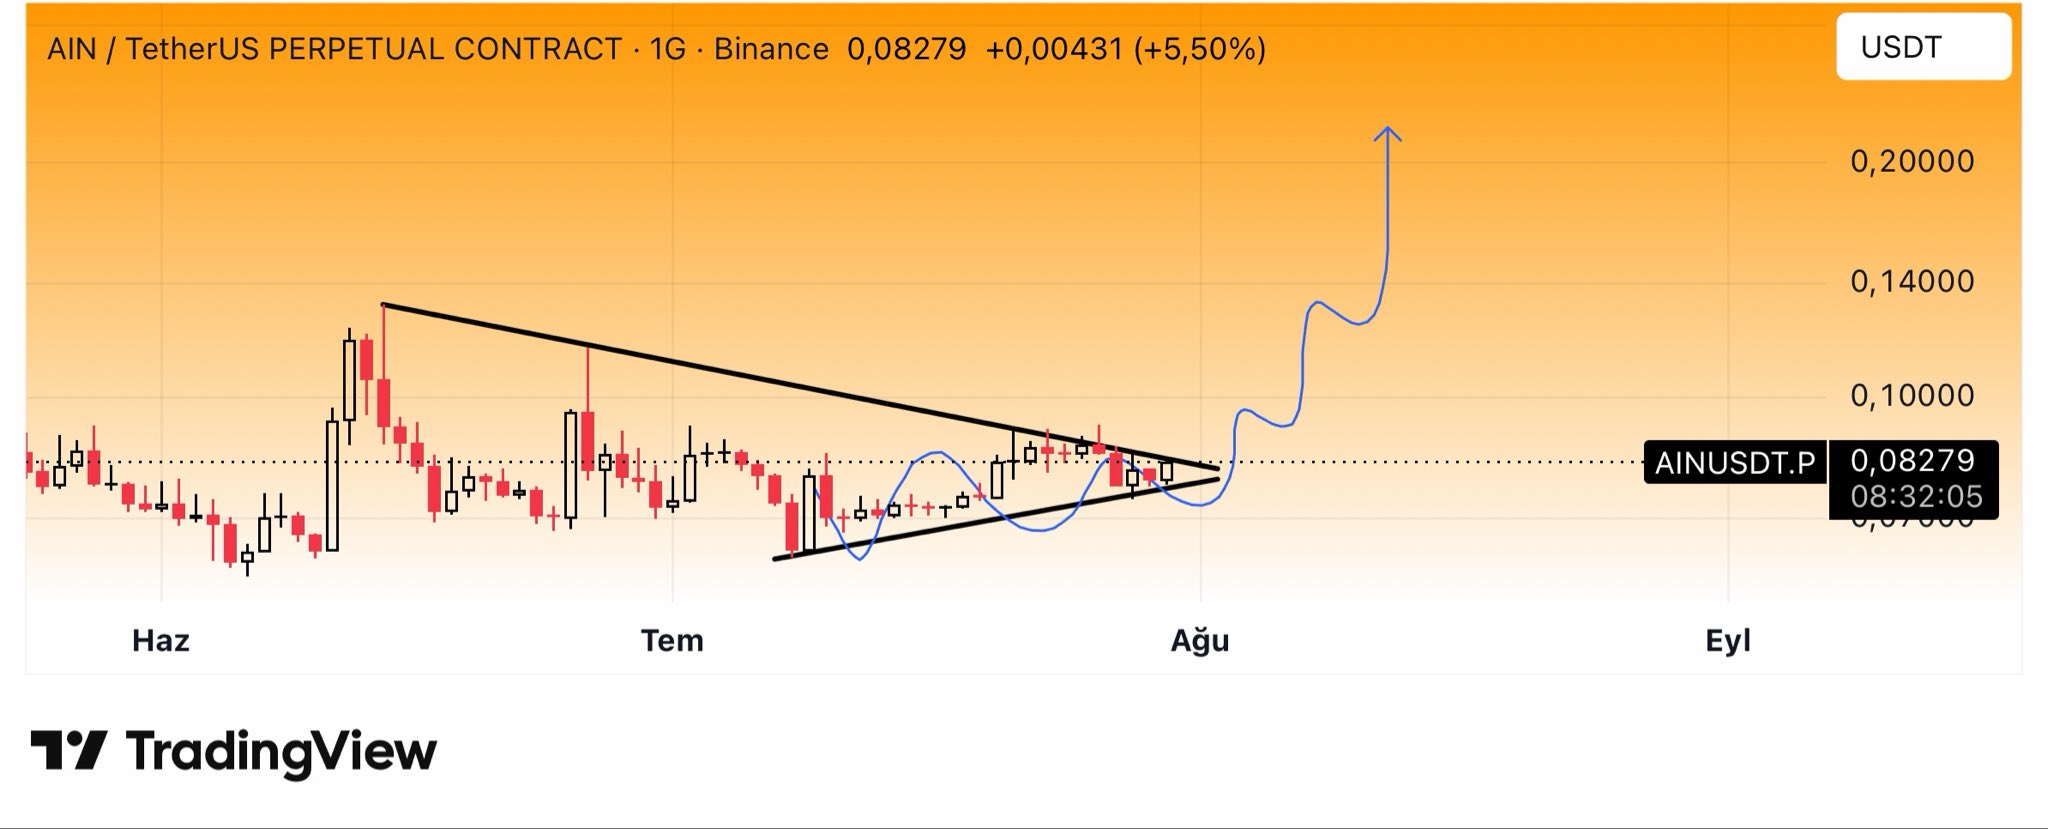
 極度看漲
AIN forms a strong convergence; a breakout could lead to a sharp rise.
Crypto Tolga
TA_Analyst
Trader
B
79.1K @CryptoTolga_ #ain #binance $ain #altcoin
There is an extremely strong compression. If $ain manages to break this point, we will see a strong upward movement. https://t.co/KD2VtMZk52
 91
91
 14
14
 14.9K
14.9K
2026-07-30 18:17
發佈後AIN走勢
極度看漲
AIN forms a strong convergence; a breakout could lead to a sharp rise.
Crypto Tolga
TA_Analyst
Trader
B
79.1K @CryptoTolga_ 極度看漲
AIN is in a strong consolidation; after a breakthrough, it is expected to see a significant rise.
Crypto Tolga
TA_Analyst
Trader
B
79.1K @CryptoTolga_ #ain #binance $ain #altcoin
There is an extremely strong compression. If $ain manages to break this point, we will see a strong upward movement. https://t.co/KD2VtMZk52
91
14
14.9K
2026-07-30 16:17
發佈後AIN走勢
極度看漲
AIN is in a strong consolidation; after a breakthrough, it is expected to see a significant rise.
Crypto Tolga
TA_Analyst
Trader
B
79.1K @CryptoTolga_ 極度看漲
AIN is forming a strong convergent pattern; a breakout could trigger a sharp rise.
Crypto Tolga
TA_Analyst
Trader
B
79.1K @CryptoTolga_ #ain #binance $ain #altcoin
There is an extremely strong compression. If $ain manages to break this point, we will see a strong upward movement. https://t.co/KD2VtMZk52
91
14
14.9K
2026-07-30 15:57
發佈後AIN走勢
極度看漲
AIN is forming a strong convergent pattern; a breakout could trigger a sharp rise.
價格預測
什麼時候是購買AIN的好時機?我應該現在買入還是賣出AIN?
在判斷現在是否是買入或賣出 AInalyst (AIN) 的合適時機時,首先需要結合自身的交易策略和風險承受能力。長期投資者與短期交易者對市場信號的解讀往往不同,因此建議根據個人交易計劃做出決策。 根據最新的 AIN 4 小時技術分析,當前交易信號為買入。

Beacon預測
概率價格預測(未來24小時)Beacon預測免責聲明
當面頁面的數據結果基於當前交易對的實際交易數據(OCHLV)和相應的指標計算,然後進行分析得出結果。
此預測為實驗性技術產品,僅供參考,不構成投資建議。現實生活中的任何突發事件都可能對交易行為產生重大影響,因此交易者應謹慎決策。
此預測為實驗性技術產品,僅供參考,不構成投資建議。現實生活中的任何突發事件都可能對交易行為產生重大影響,因此交易者應謹慎決策。
關於 AInalyst
AInalyst (AIN) is a cryptocurrency and operates on the Base platform. AInalyst has a current supply of 1,000,000,000 with 0 in circulation. The last known price of AInalyst is 0.00005051 USD and is up 1.43 over the last 24 hours. It is currently trading on 2 active market(s) with $0.00 traded over the last 24 hours. More information can be found at https://ainalyst.xyz/.
查看更多
購買 AIN
交易 AIN