


📺 Ubisoft shuts Champions Tactics Oct 30 as WEMIX loses $724K to exploit
Learn more about:
Full breakdown 👇
➡️ Watch Video: https://t.co/85N6fwxxcI
活動
合約每日抽獎
每日交易100%中獎
現貨每日抽獎
抽 8,888 USDT 豪禮
投票上幣
投票支持區塊鏈資產,賺取空投
機構
專為機構打造的解決方案
VIP
解鎖專屬福利
BitMart 學院
快速學習入門交易,瞭解區塊鏈知識
BitMart 大使
學習、建設 Web3,從 BitMart 起航
BitMart Travel
全球旅行服務,一站式預訂
BitMart話費充值
話費、流量、套餐便攜充值
轉帳
安全便捷,隨時隨地全球匯款
幣市商城
用加密貨幣滿足您的一切消費需求
WEMIX 實時價格數據
今日WEMIX的實時價格為$ 0.19 (WEMIX/USD), 當前市值為 $ 99.85M USD。 24小時的成交量為 $ 448.77K USD。 過去24小時內漲跌幅為 +0.00%, 流通量為 499.36M WEMIX。
WEMIX WEMIX 價格歷史 USD
跟蹤 WEMIX 的今日價格、7天、30天和90天價格
週期
漲跌
漲跌幅 (%)
今日
$ 0
0.00%
7日
--
--
30日
--
--
90日
--
--
WEMIX 市場信息
$ 0.19 24小時價格浮動區間 $ 0.19
歷史最高
$ 0
歷史最低
$ 0
24小時漲跌幅
0.00%
24小時交易量
$ 448,774.22
流通供給
499.36M
WEMIX
市值
$ 99.85M
最大供給
0.59B
WEMIX
完全稀釋的市值
$ 117.97M
交易 WEMIX
WEMIX 社交媒體動態

PlayToEarn
Media
Researcher
D
 83.0K @PlayToEarn
 極度看跌
WEMIX因漏洞损失724K美元,短期看空
 24
24
 7
7
 8.6K
8.6K
2026-07-31 12:57
發佈後WEMIX走勢
看跌
WEMIX因漏洞损失724K美元,短期看空

Kurnia Bijaksana
Trader
Educator
C
46.9K @mkbijaksana 極度看漲
The tweet shares an altcoin trading strategy that identifies and follows rising trends when BTC dominance is falling and altcoins are bullish.
Pro tip: If the market is in a condition where
- BTC dominance is falling
- TOTAL2 shows a bullish signal
- Large altcoins are above the 21 EMA on the 1-day timeframe
Check the method below
Kurnia Bijaksana
Trader
Educator
C
46.9K @mkbijaksana DAILY CRYPTO TRADING TUTORIAL: FOLLOW THE TREND (BULLISH)
This method utilizes the follow‑the‑trend principle.
My principle: What goes up will keep going up until a reversal sign appears.
Therefore, we take advantage of assets that are gaining momentum and try to follow their upward move.
Step 1: Market Screening.
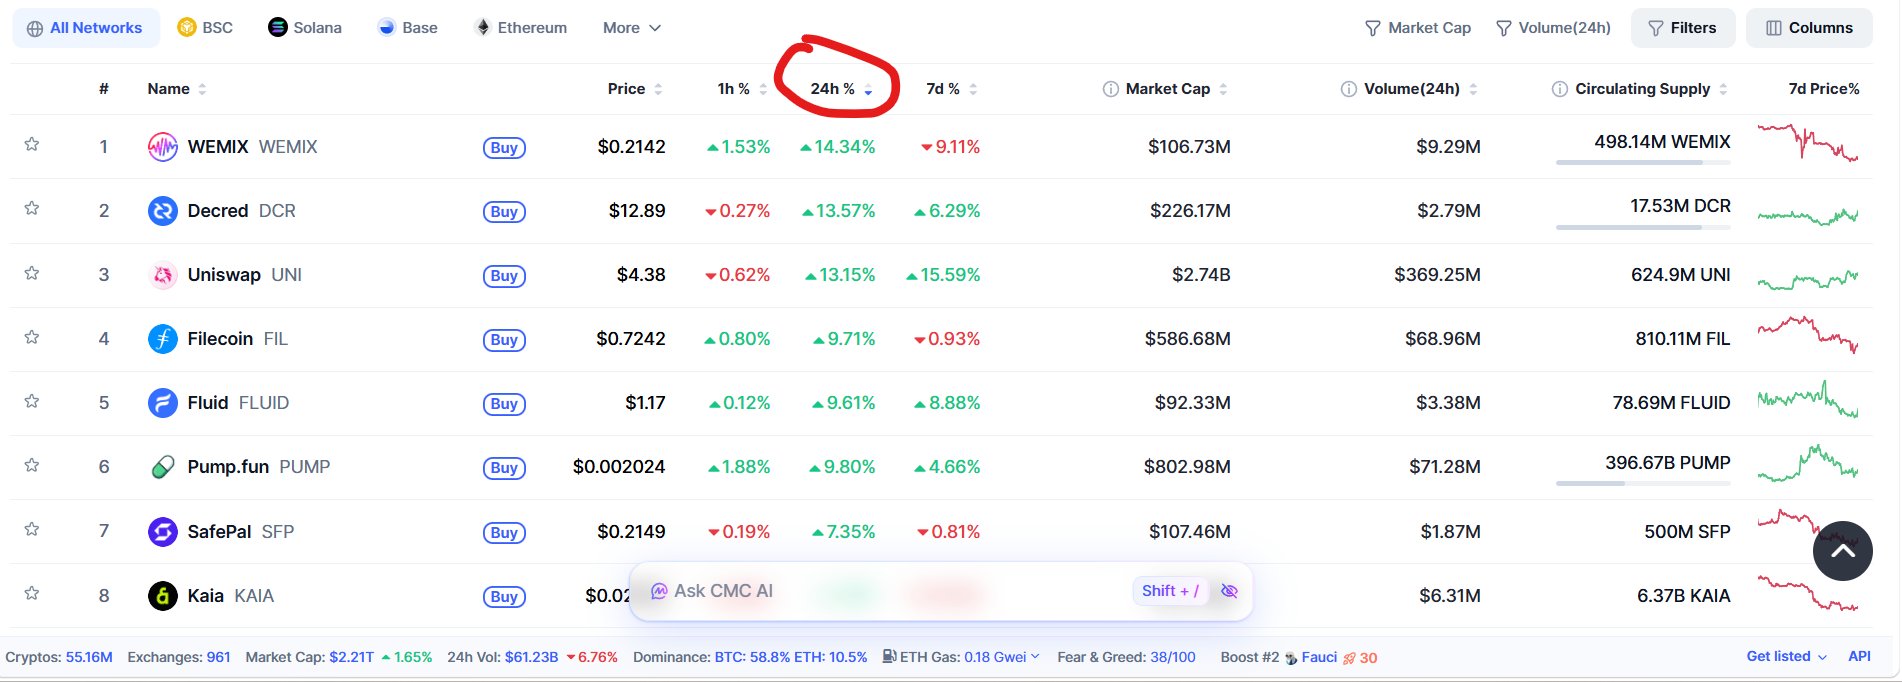
Go to CoinMarketCap, or your favorite exchange. Sort by 24H% or top gainers. You can click the 24H% or %Gains column depending on the exchange, until it lists the highest (see image 1). The example image shows WEMIX, DCR, UNI, among others.
Step 2: Ensure a bullish bias.
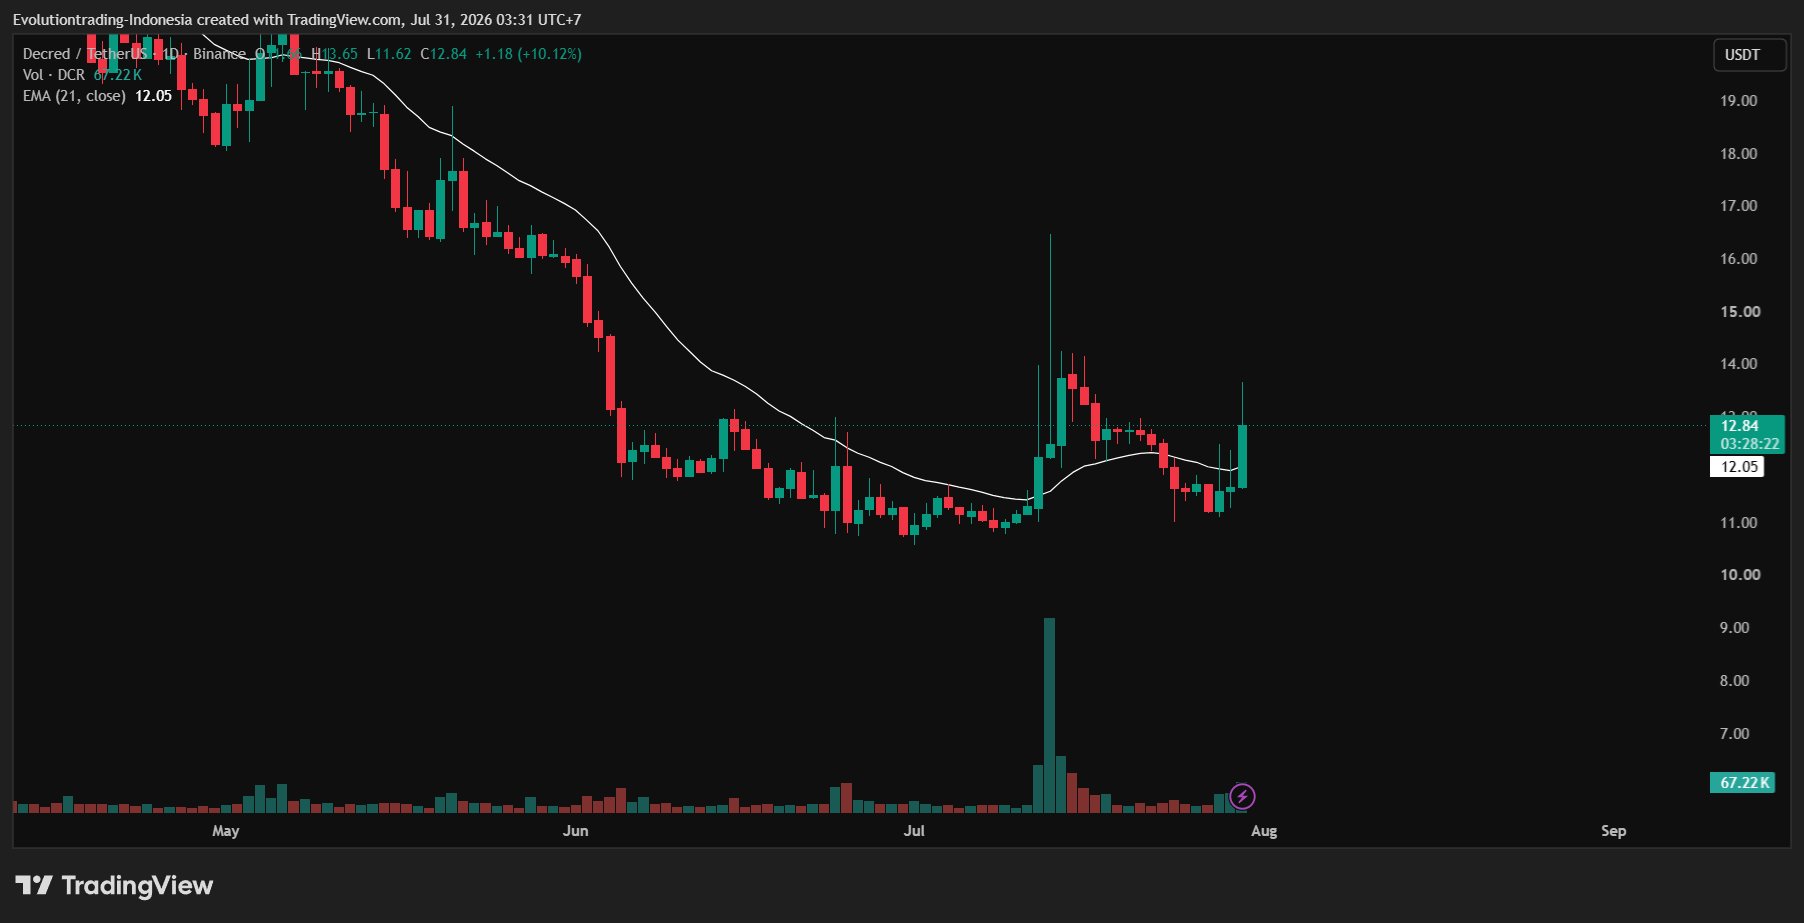
Open TradingView (or the exchange you use, on its chart). Switch to the 1‑day timeframe first. Make sure:
- The chart is bullish (green) and
- Not too high. Avoid charts that look like tall pillars on the 1‑day timeframe; they are usually too late.
(See example in image 2)
You can look at several charts, mark those meeting the criteria, then proceed to step 3.
Step 3: Entry Trigger
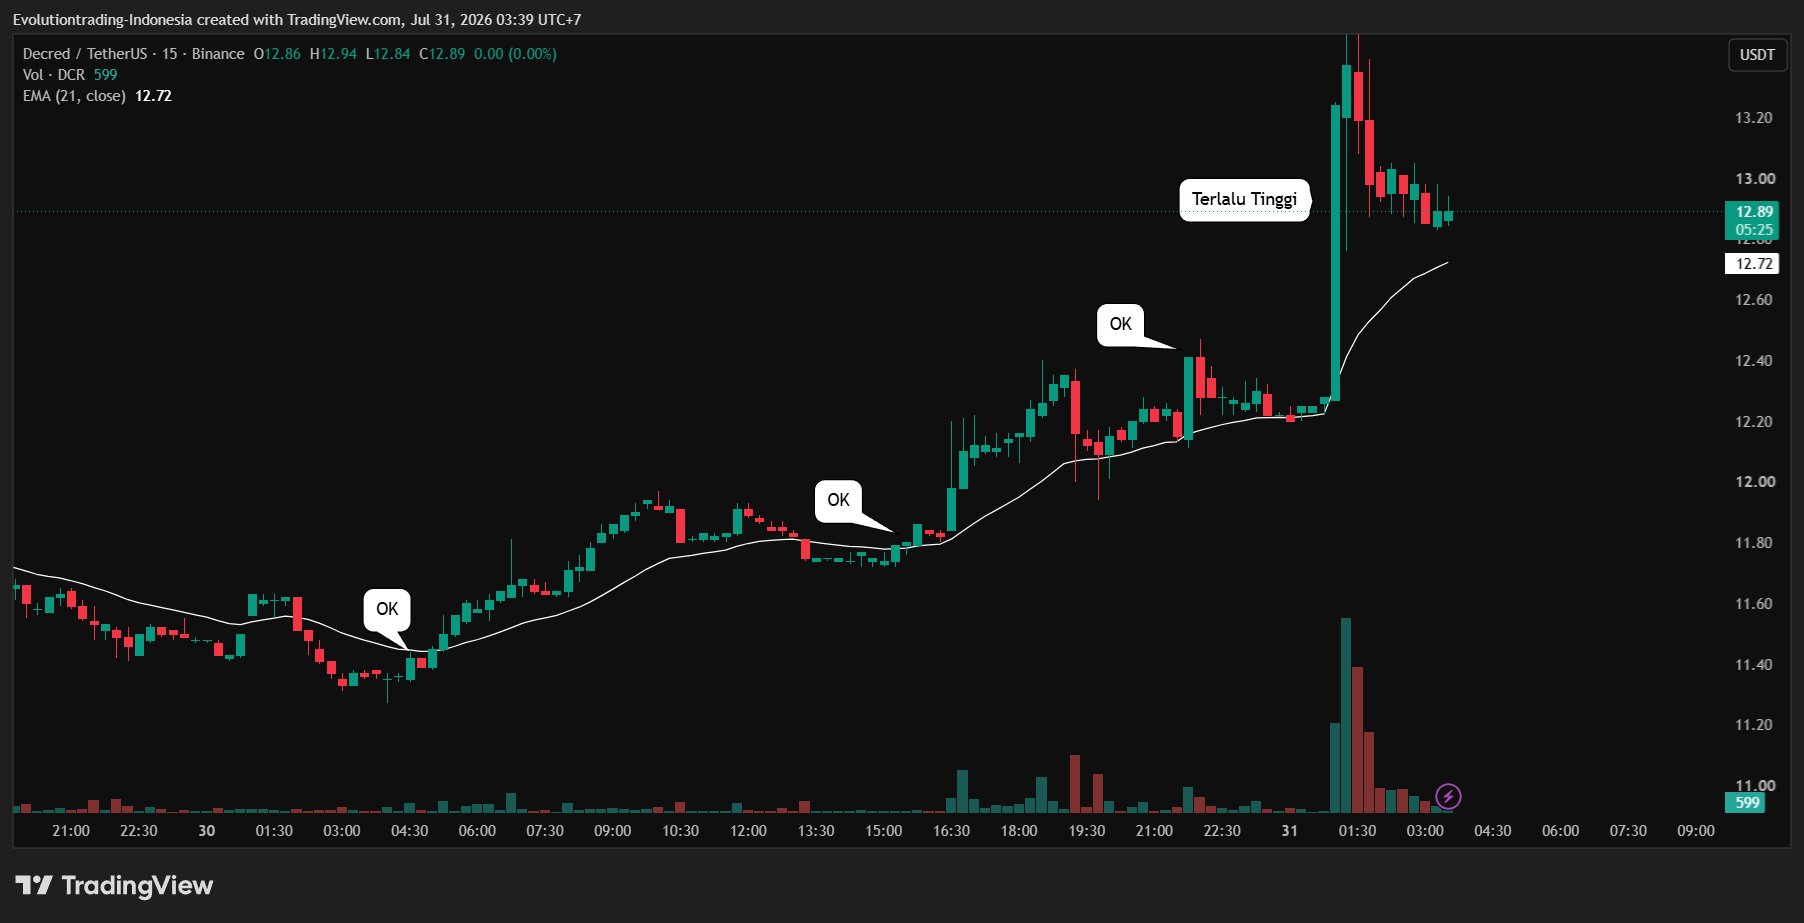
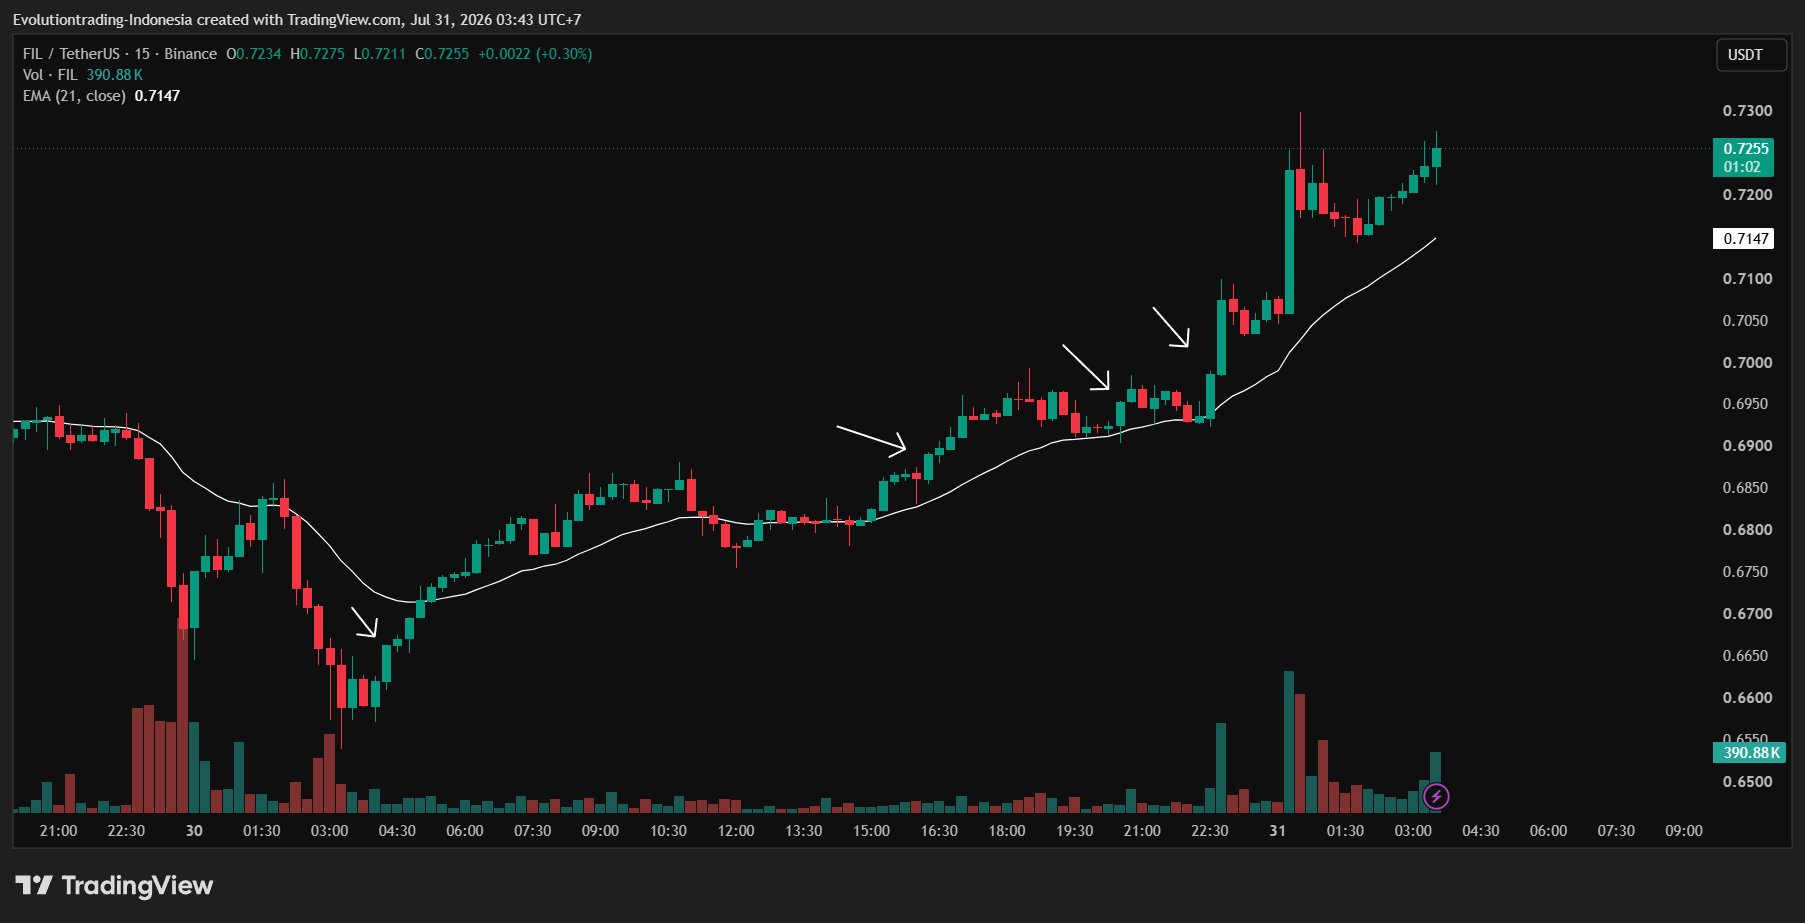
There are many ways, I will discuss them later.
 21
0
2.3K
21
0
2.3K
2026-07-31 04:57
發佈後WEMIX走勢
極度看漲
The tweet shares an altcoin trading strategy that identifies and follows rising trends when BTC dominance is falling and altcoins are bullish.
Kurnia Bijaksana
Trader
Educator
C
46.9K @mkbijaksana 看漲
The tweet shares an altcoin trading strategy that identifies and follows rising trends when BTC dominance is falling and altcoins are bullish.
DAILY CRYPTO TRADING TUTORIAL: FOLLOW THE TREND (BULLISH)
This method utilizes the follow‑the‑trend principle.
My principle: What goes up will keep going up until a reversal sign appears.
Therefore, we take advantage of assets that are gaining momentum and try to follow their upward move.
Step 1: Market Screening.
Go to CoinMarketCap, or your favorite exchange. Sort by 24H% or top gainers. You can click the 24H% or %Gains column depending on the exchange, until it lists the highest (see image 1). The example image shows WEMIX, DCR, UNI, among others.
Step 2: Ensure a bullish bias.
Open TradingView (or the exchange you use, on its chart). Switch to the 1‑day timeframe first. Make sure:
- The chart is bullish (green) and
- Not too high. Avoid charts that look like tall pillars on the 1‑day timeframe; they are usually too late.
(See example in image 2)
You can look at several charts, mark those meeting the criteria, then proceed to step 3.
Step 3: Entry Trigger
There are many ways, I will discuss them later.
190
6
32.6K
2026-07-31 03:17
發佈後WEMIX走勢
看漲
The tweet shares an altcoin trading strategy that identifies and follows rising trends when BTC dominance is falling and altcoins are bullish.
價格預測
什麼時候是購買WEMIX的好時機?我應該現在買入還是賣出WEMIX?
在判斷現在是否是買入或賣出 WEMIX (WEMIX) 的合適時機時,首先需要結合自身的交易策略和風險承受能力。長期投資者與短期交易者對市場信號的解讀往往不同,因此建議根據個人交易計劃做出決策。 根據最新的 WEMIX 4 小時技術分析,當前交易信號為持有。

Beacon預測
概率價格預測(未來24小時)Beacon預測免責聲明
當面頁面的數據結果基於當前交易對的實際交易數據(OCHLV)和相應的指標計算,然後進行分析得出結果。
此預測為實驗性技術產品,僅供參考,不構成投資建議。現實生活中的任何突發事件都可能對交易行為產生重大影響,因此交易者應謹慎決策。
此預測為實驗性技術產品,僅供參考,不構成投資建議。現實生活中的任何突發事件都可能對交易行為產生重大影響,因此交易者應謹慎決策。
關於 WEMIX
WEMIX (WEMIX) is a cryptocurrency launched in 2020. WEMIX has a current supply of 560,158,782.4927065 with 499,361,870.28307045 in circulation. The last known price of WEMIX is 0.19399076 USD and is up 1.22 over the last 24 hours. It is currently trading on 65 active market(s) with $346,636.25 traded over the last 24 hours. More information can be found at http://wemix.com/.
查看更多
購買 WEMIX
交易 WEMIX